Figures & data
Table 1 Characteristic of GC patients
Figure 1 Optimal cut-off points for NLR, dNLR, MLR, PLR, and PNI were applied with ROC curves.
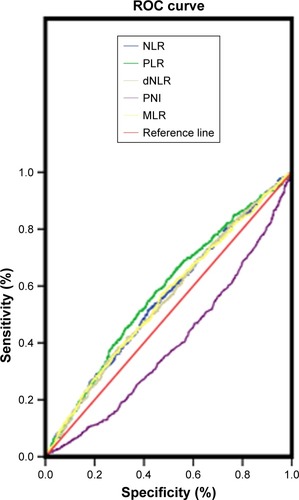
Table 2 The optimal cut-off point for overall survival
Table 3 Relationship between clinicopathological characteristics and NLR, dNLR, MLR, PLR, and PNI
Figure 2 Kaplan–Meier curves for overall survival according to NLR, dNLR, MLR, PLR, and PNI.
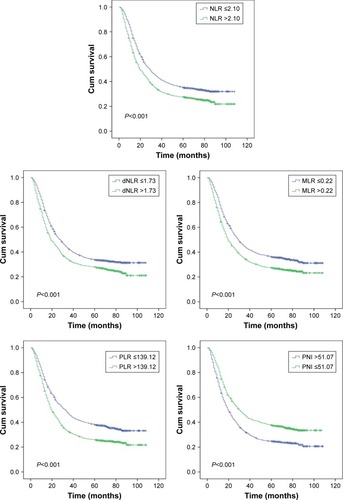
Table 4 Univariate and multivariate analysis of factors for overall survival
Figure 3 Kaplan–Meier curves for overall survival according to scores of dNLR and MLR.
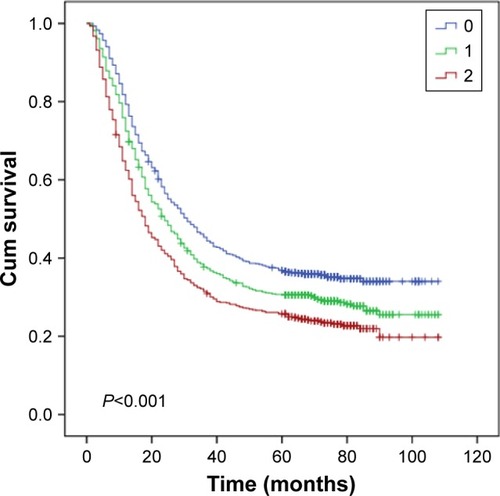
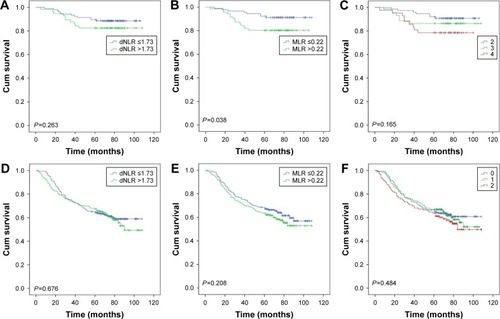
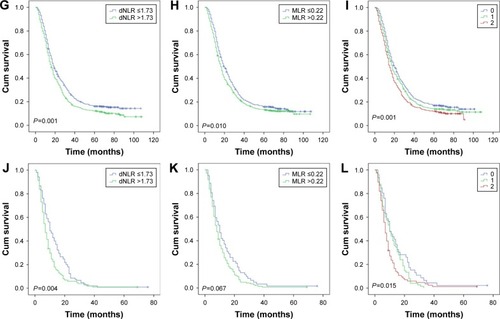
Figure 4 Overall survival stratified by TNM stage of dNLR, MLR, and their combination score. A, D, G, and J were stages I, II, III, and IV of dNLR, respectively; B, E, H and K were stages I, II, III, and IV of MLR, respectively; C, F, I, and L were stages I, II, III, and IV of their combination scores.