Figures & data
Figure 1 Flowchart of the selection of the studies in the meta-analysis.
Abbreviation: ELISA, enzyme-linked immunoabsorbent assay.
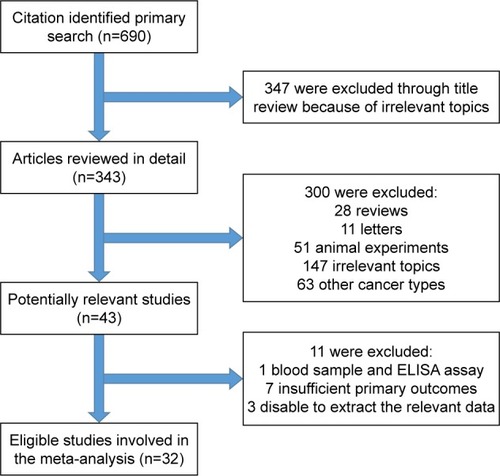
Table 1 Characteristics of included studies for meta-analyses
Figure 2 Forest plot of HR for the association of PD-L1 overexpression and OS.
Note: Weights are from random-effects analysis.
Abbreviations: CI, confidence interval; HR, hazard ratio; OS, overall survival.
Abbreviations: CI, confidence interval; HR, hazard ratio; OS, overall survival.
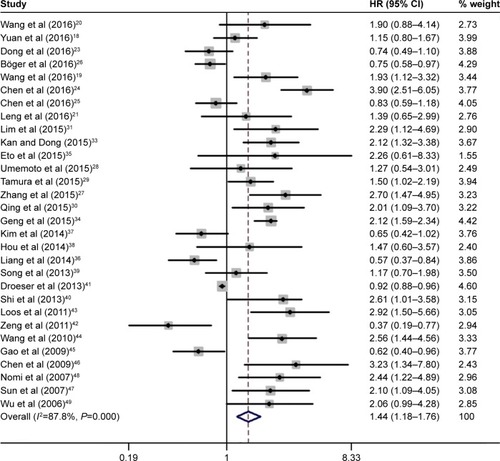
Table 2 Main meta-analysis results for OS
Figure 3 Forest plot of HR for the association of PD-L1 overexpression and RFS.
Note: Weights are from random-effects analysis.
Abbreviations: CI, confidence interval; HR, hazard ratio; RFS, recurrence-free survival.
Abbreviations: CI, confidence interval; HR, hazard ratio; RFS, recurrence-free survival.
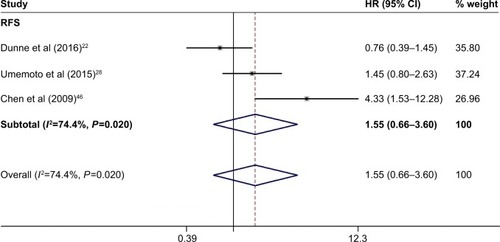
Figure 4 Forest plot of HR for the association of PD-L1 overexpression and DFS.
Note: Weights are from random-effects analysis.
Abbreviations: CI, confidence interval; DFS, disease-free survival; HR, hazard ratio.
Abbreviations: CI, confidence interval; DFS, disease-free survival; HR, hazard ratio.
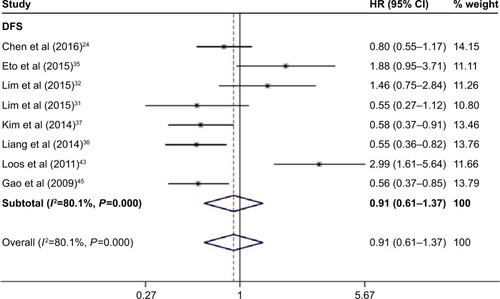
Table 3 Main meta-analysis results for DFS
Figure 5 Sensitivity analysis of pooled HRs on the association between PD-L1 expression and OS.
Abbreviations: CI, confidence interval; HR, hazard ratio; OS, overall survival.
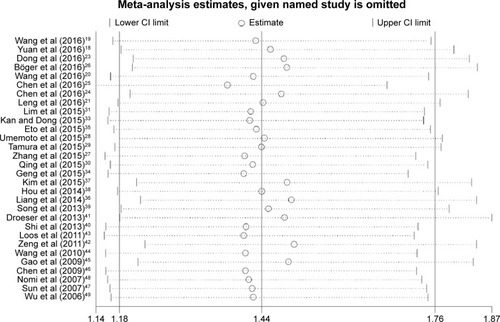
Table 4 Meta-regression analyses of potential source of heterogeneity
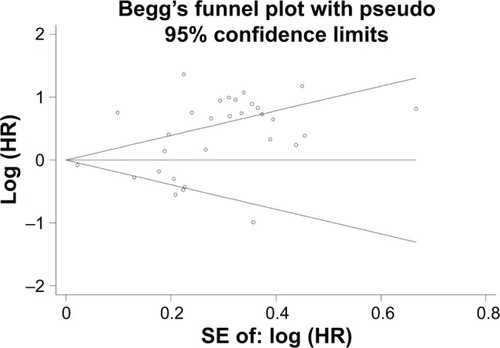
Figure 6 Funnel plots of publication bias for all the included studies reported with OS.
Abbreviations: HR, hazard ratio; OS, overall survival; SE, standard error.