
Figures & data
Figure 1 MiR-144-3p expression in HCC tissues in TCGA data.
Abbreviations: HCC, hepatocellular carcinoma; TCGA, The Cancer Genome Atlas.
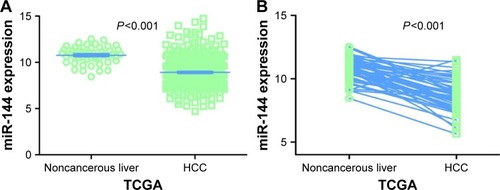
Figure 2 Diagnostic value of miR-144-3p in HCC.
Abbreviations: AUC, area under the curve; HCC, hepatocellular carcinoma; qRT-PCR, quantitative reverse transcription-polymerase chain reaction; ROC, receiver operating characteristic; TCGA, The Cancer Genome Atlas.
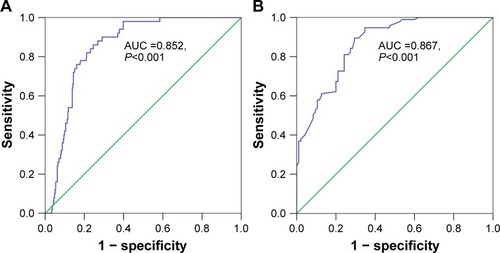
Table 1 Expression of miR-144-3p and clinicopathologic parameters in HCC in TCGA
Figure 3 MiR-144-3p expression detected by qRT-PCR validation.
Abbreviations: HCC, hepatocellular carcinoma; qRT-PCR, quantitative reverse transcription-polymerase chain reaction; TNM, tumor node metastasis.
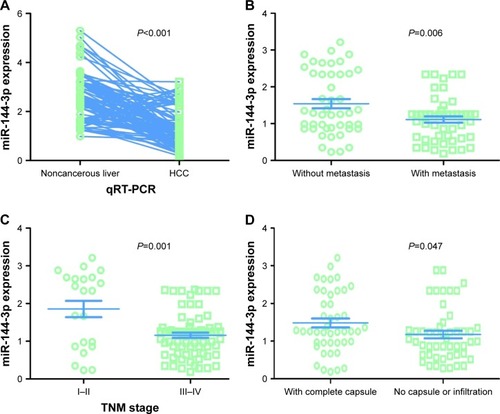
Table 2 Expression of miR-144-3p and clinicopathologic parameters in HCC in the 95 pairs detected by qRT-PCR
Figure 4 Diagnostic value of miR-144-3p in AFP-positive and AFP-negative HCC.
Abbreviations: AFP, alpha-fetoprotein; AUC, area under the curve; HCC, hepatocellular carcinoma; ROC, receiver operating characteristic.
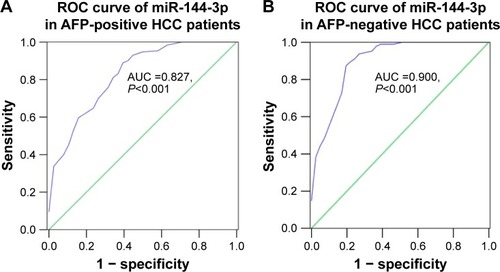
Figure 5 The forest plots for the meta-analysis of miR-144-3p expression in HCC.
Abbreviations: HCC, hepatocellular carcinoma; qRT-PCR, quantitative reverse transcription-polymerase chain reaction; SMD, standard mean difference; TCGA, The Cancer Genome Atlas.
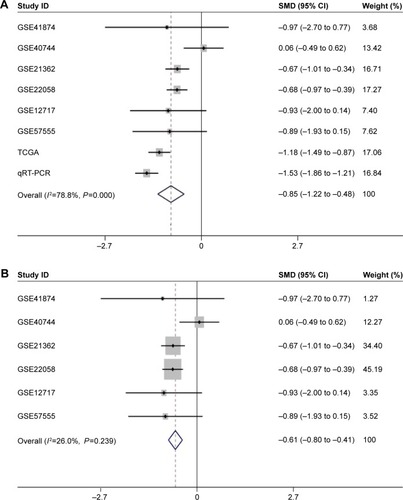
Figure 6 The funnel plot of the meta-analysis of miR-144-3p expression in HCC.
Abbreviations: HCC, hepatocellular carcinoma; SE, standard error; SMD, standard mean difference.
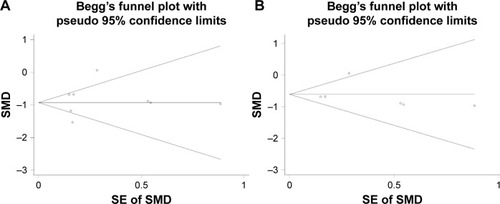
Figure 7 The flowchart of the gene functional enrichment.
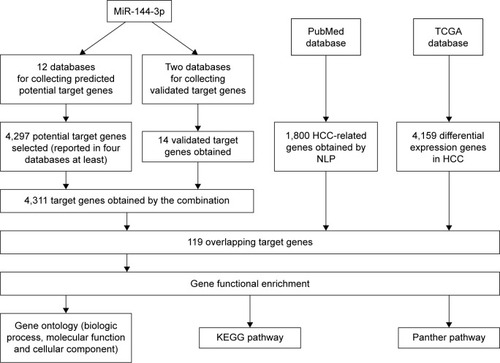
Table 3 GO analysis of the targets of miR-144-3p obtained from predicted target genes, validated targets, TCGA and NLP
Figure 8 The BINGO analysis network: BP.
Abbreviation: BP, biologic processes.
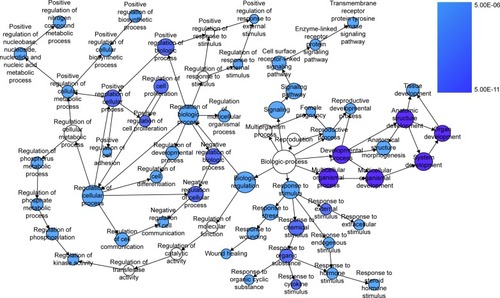
Figure 9 The BINGO analysis network: CC.
Abbreviation: CC, cellular components.
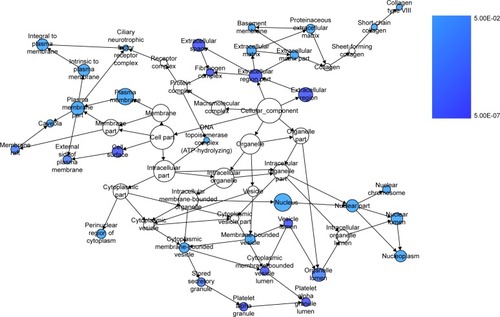
Figure 10 The BINGO analysis network: MF.
Abbreviation: MF, molecular functions.
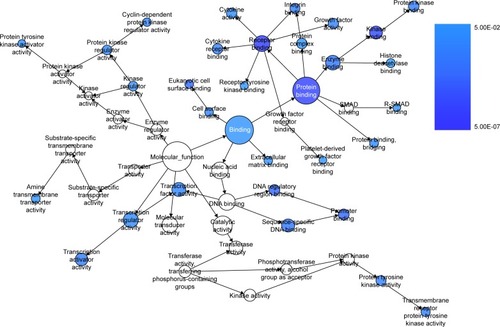
Figure 11 Protein–protein interaction of the overlapping genes between the predicted target genes of miR-144-3p and the NLP analysis.
Abbreviations: HCC, hepatocellular carcinoma; NLP, natural language processing; TCGA, The Cancer Genome Atlas.
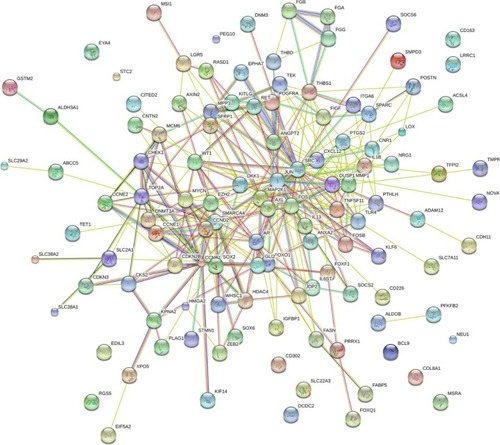
Table 4 Pathway enrichment in KEGG databases of the targets of miR-144-3p obtained from the predicted target genes, the NLP analysis and the TCGA data
Table 5 Pathway enrichment in Panther database of the targets of miR-144-3p obtained from the predicted target genes, the NLP analysis and the TCGA data