Figures & data
Figure 1 Flow diagram of the meta-analysis study selection process.
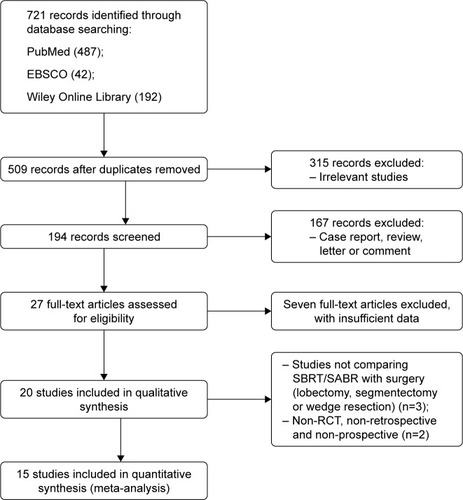
Table 1 Basic characteristics of all of the pooled studies in the meta-analysis
Figure 2 Forest plot of the survival for SBRT/SABR group versus surgical group. Including the OS (A) and the RFS (B).
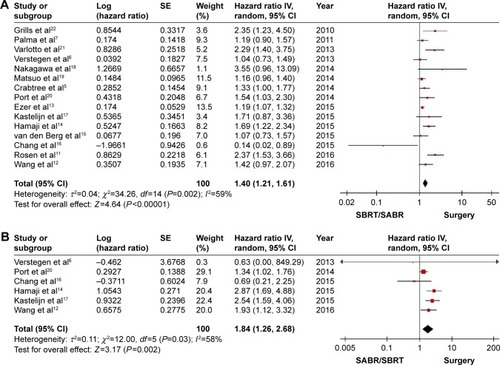
Figure 3 Results publication bias analysis – funnel plot.
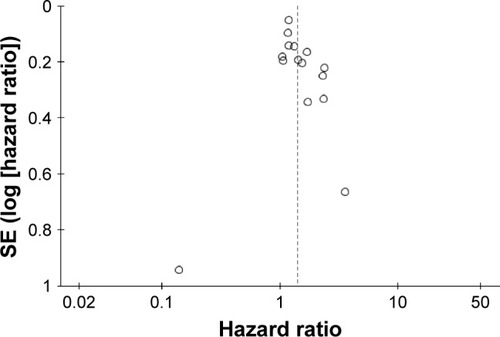
Figure 4 Forest plot of the incidence of recurrence for SBRT/SABR group versus surgical group, including (A) the incidence of locoregional recurrence and (B) the incidence of distant recurrence.
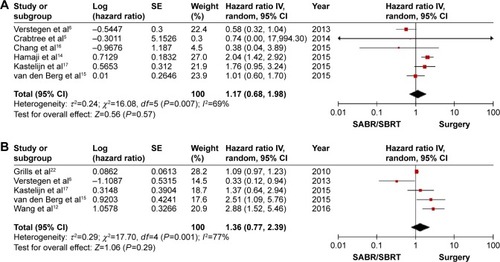
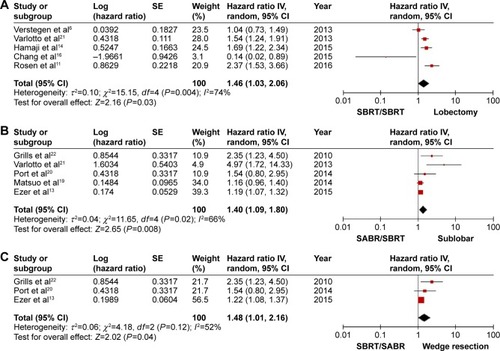
Figure 5 Forest plot of the OS for SBRT/SABR group versus different surgical groups, including (A) the OS for SBRT/SABR group versus lobectomy, (B) the OS for SBRT/SABR group versus sublobectomy, and (C) the OS for SBRT/SABR group versus wedge resection.