Figures & data
Figure 1 SHP2 overexpression in human ovarian cancer cell lines.
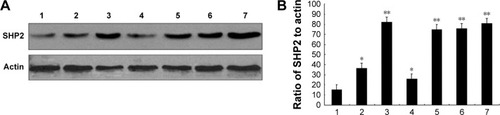
Figure 2 SHP2 overexpression in human ovarian tumor tissues.
Abbreviations: N, normal; T, tumor.
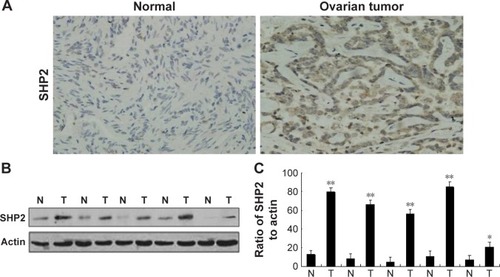
Table 1 Expression of SHP2 in normal ovarian tissues and epithelial ovarian cancer
Table 2 Correlation between SHP2 expression and clinicopathological factors in epithelial ovarian cancer
Figure 3 SHP2 overexpression enhances the proliferation of A2780 cells.
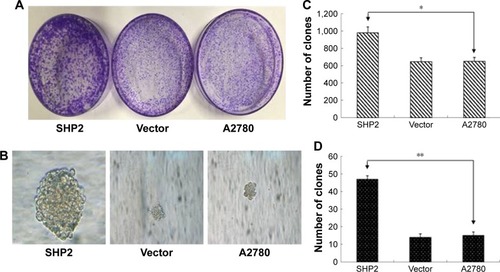
Figure 4 SHP2 overexpression enhances the migration, invasion and proliferation of A2780 cells.
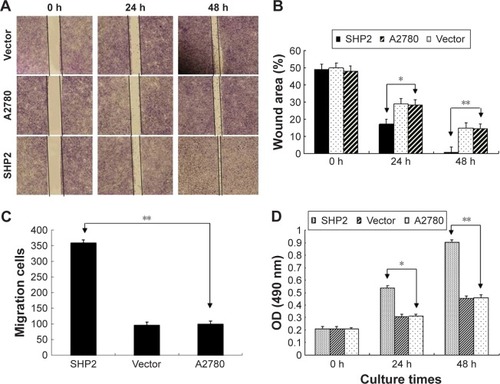
Figure 5 SHP2 overexpression is associated with increased resistance to the chemotherapeutic agent paclitaxel.
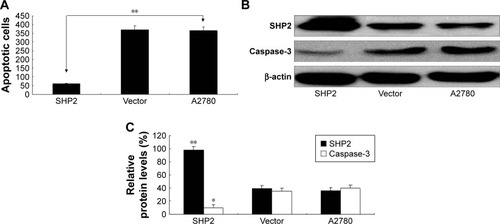
Figure 6 SHP2 overexpression promotes tumor growth and tumor angiogenesis in a mouse xenograft model.
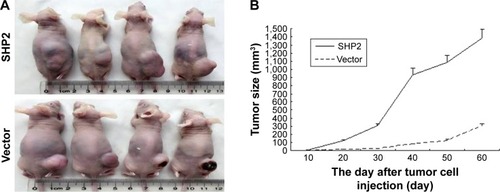
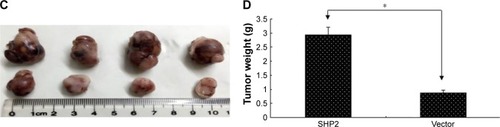
Figure 7 Effect of SHP2 overexpression on tumor metastasis.
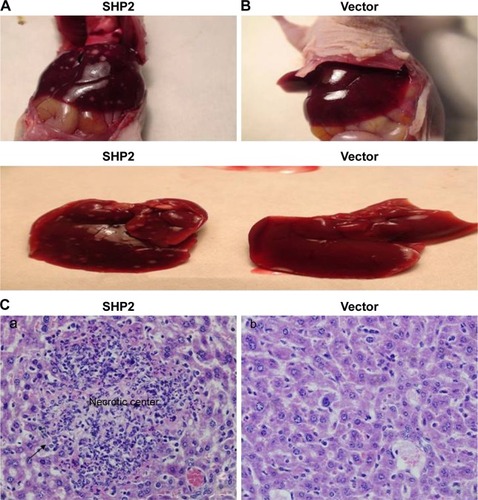
Table 3 Effect of SHP2 on tumor (A2780) metastases in different organs of mice bearing xenografted tumors
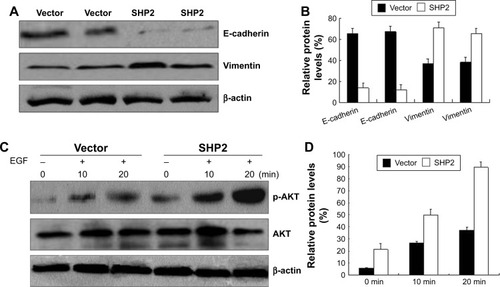
Figure 8 SHP2 overexpression enhances cell migration and invasion by increasing phospho-AKT levels in ovarian cancer cells.
Abbreviation: FBS, fetal bovine serum.