
Figures & data
Figure 1 Differential expression of LGI3 and its receptors in glioma tissues.
Notes: (A) Volcano plot of mRNA expression microarray dataset. (B) Bar-and-whisker plot of expression of LGI3, ADAM22 and ADAM23 in glioma tissues. Open bar, control (nontumor) tissues; shaded bar, glioma tissues. *P<0.001.
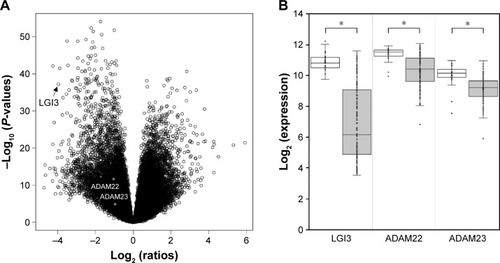
Figure 2 Comparative analysis of the glioma-altered gene products and LGI3-regulated genes.
Notes: (A) Venn diagram indicating the common sets of the groups of the regulated genes in each category. (B) Protein–protein interaction network of LGI3-regulated and glioma-altered gene products. The network was depicted by lines (pairwise protein interactions) and nodes (gene products) sorted by interaction degree. The marks (*, +, #) indicate the gene products in the common sets of the groups of the regulated genes indicated in A.

Table 1 Functional enrichment analysis of LGI3-regulated genes that are changed in glioma
Table 2 KEGG pathway analysis of LGI3-regulated genes that are changed in glioma
Figure 3 Associations between expression microarray analyses of LGI3 (A), ADAM22 (B) and ADAM23 (C) and glioma prognosis in patient cohorts.
Note: Kaplan–Meier survival curves of microarray dataset of patient groups ().
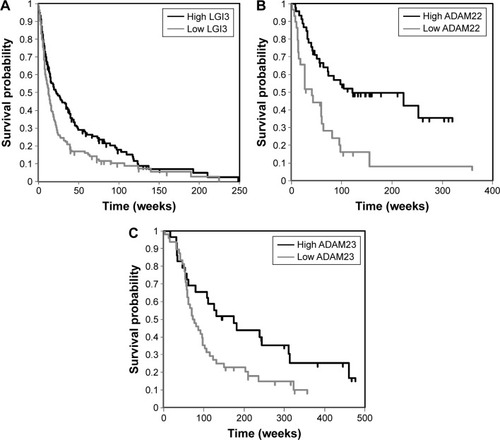
Table 3 Dataset summary of expression microarray analyses for glioma studies