Figures & data
Figure 1 Differently expressed gene in grade I to IV glioma. (A) 3726 genes were deregulated in high-grade glioma under the condition of “Q <0.05 and fold change >1.2”. (B) 749 genes were deregulated in high-grade glioma under the condition of “Q <0.001 and fold change >2”. (C) Top 20 expression signature genes.
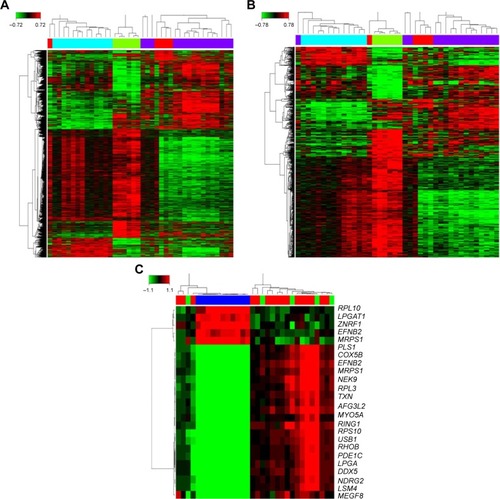
Figure 2 Cluster analysis of differently expressed gene, (A) the top 20 significant cluster profiles. (B) Of these clusters, number 80 comprised genes that gradually expressed different levels at different points of time.
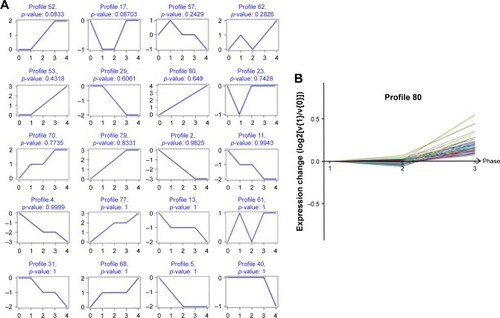
Figure 3 Gene Ontology and pathway analysis. (A) Top 15 highly enriched GO terms. (B) Top 15 highest degree pathways.
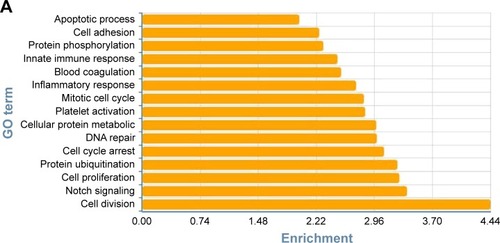
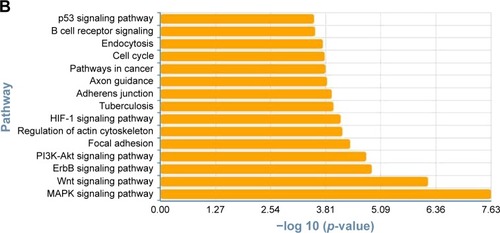
Figure 4 Pathway relation network and gene coexpression network. (A) Fifty two significantly changed pathways relation network. (B) All differently expressed genes in a coexpression network. (C) The COX5B gene localizes at the center of subnetwork in the coexpression network, which directly regulates 15 adjacent genes that network according to their degrees. Node size represents the degree of centrality.
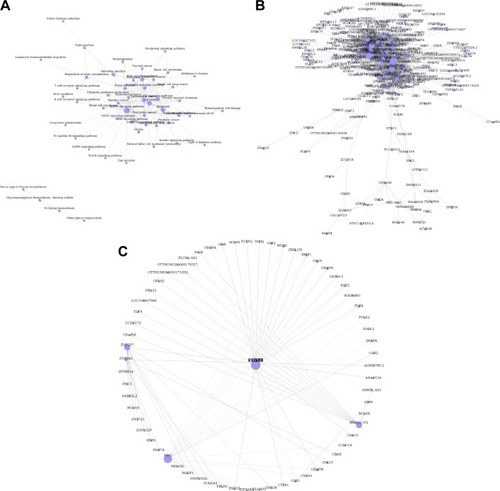
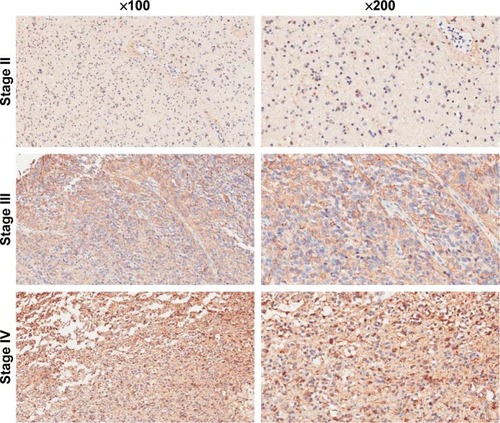
Figure 5 COX5B expression is overexpressed in different-grade II to IV glioma tissue. Magnification 200×.