
Figures & data
Table 1 Characteristics of patients
Figure 1 Kaplan–Meier plots of cancer-specific survival (A) and overall survival (B) of women and men.
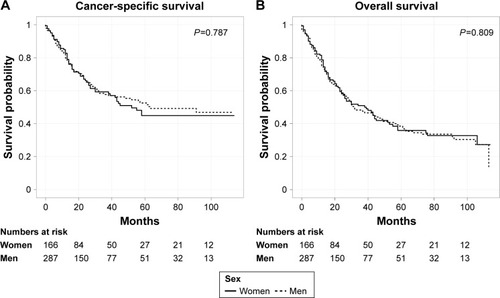
Figure 2 Kaplan–Meier plots of cancer-specific survival of adenocarcinoma stratified by sex.
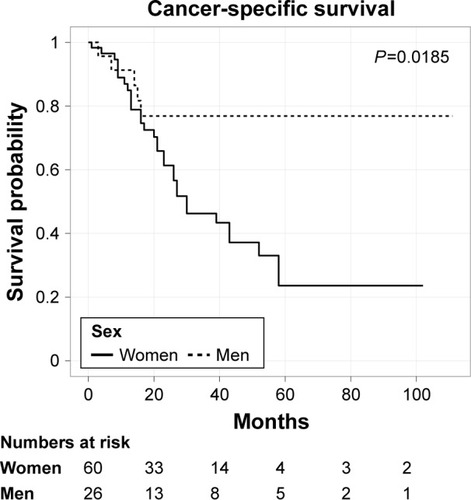
Figure 3 Kaplan–Meier plots of cancer-specific survival in men patients stratified by transitional cell carcinoma (TCC) and adenocarcinoma (Ac).

Figure 4 Kaplan–Meier plots of cancer-specific survival in men patients stratified by transitional cell carcinoma (TCC) and squamous cell carcinoma (SCC).
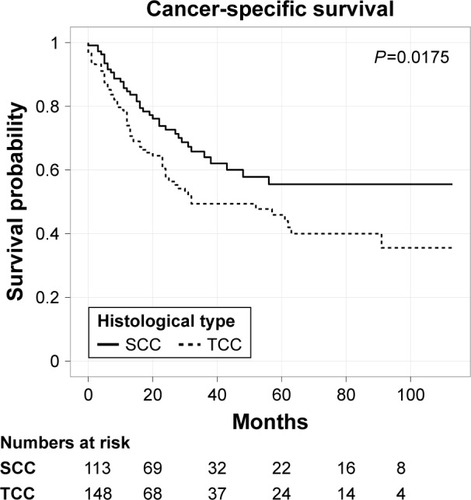
Table 2 Univariate and multivariate analysis of overall survival in women
Table 3 Univariate and multivariate analysis of cancer-specific survival in women
Table 4 Univariate and multivariate analysis of overall survival in men
Table 5 Univariate and multivariate analysis of cancer-specific survival in men