Figures & data
Figure 1 Cellular proliferation by AKT phosphorylation is induced by ARID1A knockdown.
Notes: (A) Western blotting for the screening of ARID1A in gastric cancer cell lines. (B–D) After transfection of ARID1A siRNA, cell viabilities were significantly increased (**P<0.001; paired t-test). Knockdown of ARID1A increased the phosphorylation of AKT and the downstream S6.
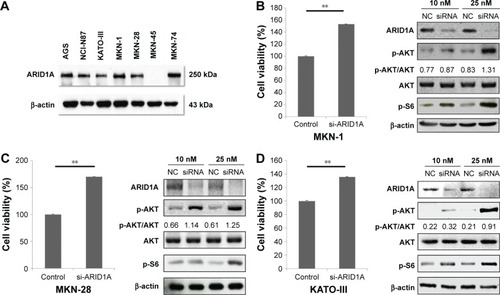
Figure 2 ARID1A depletion leads to increased sensitivity toward AKT pathway inhibitors.
Notes: Increased sensitivity of ARID1A-depleted MKN-1, MKN-28, and KATO-III cells toward GSK690693 (AKT inhibitor) was observed than that of controls. *P<0.001; paired t-test.
Abbreviation: NC, normal control.
Abbreviation: NC, normal control.
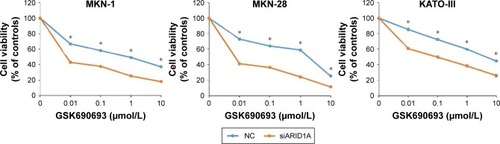
Figure 3 Loss of ARID1A expression is associated with high sensitivity to the AKT inhibitor in gastric cancer cell lines.
Notes: ARID1A-deficient MKN-45 cells showed the highest sensitivity toward GSK690693 treatment. The IC50 value of MKN-45 was 0.043, while the IC50 values of the ARID1A-intact MKN-1, MKN-28, and KATO-III cells were 0.132, 0.084, and 4.521, respectively (P<0.001). The P-value indicates the divergence of the IC50 values calculated by the F-test.
Abbreviation: IC50, half inhibitory concentration.
Abbreviation: IC50, half inhibitory concentration.
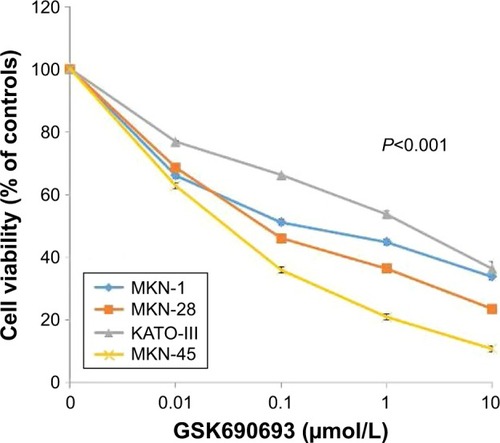
Figure 4 AKT inhibition leads to increased apoptosis in ARID1A-deficient cells.
Notes: (A) Treatment with the AKT inhibitor GSK690693 (at a concentration of 10 μmol/L) completely abrogated p-Akt induced by ARID1A knockdown in ARID1A-deficient MKN-28 cells and led to reduced p-S6, in contrast to the controls. PARP cleavage was more increased in ARID1A-knockdown cells treated with GSK690693. (B) Flow cytometry confirmed the increased apoptosis in ARID1A-deficient cells treated with GSK690693 (0.01 μmol/L) in contrast to the controls (**P<0.001; paired t-test).
Abbreviations: FITC, fluorescein isothiocyanate; PARP, poly-ADP ribose polymerase.
Abbreviations: FITC, fluorescein isothiocyanate; PARP, poly-ADP ribose polymerase.
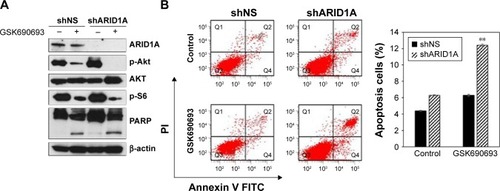
Figure 5 Loss of ARID1A expression did not induce resistance to the conventional chemotherapy.
Notes: To investigate the antiproliferative effect of conventional chemotherapy in ARID1A-depleted GC cells, 5-FU or cisplatin was applied at different drug concentrations (10–60 μmol/L) for 48 hours to MKN-1, MKN-28, and KATO-III cells transfected with control-shRNA and shARID1A. Drug sensitivities did not differ between these groups.
Abbreviations: 5-FU, 5-fluorouracil; GC, gastric cancer.
Abbreviations: 5-FU, 5-fluorouracil; GC, gastric cancer.
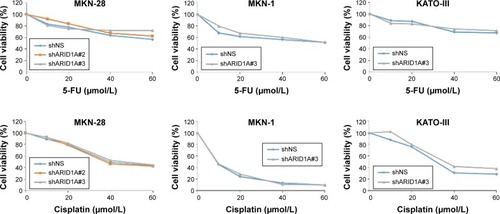
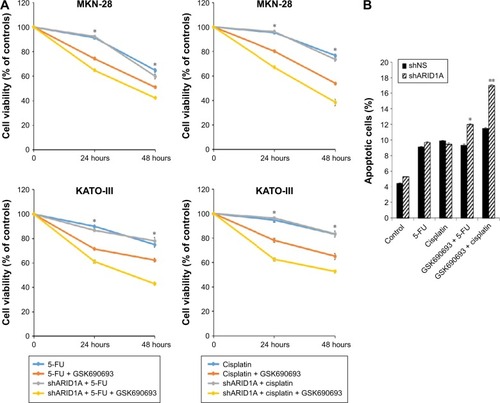
Figure 6 Addition of AKT inhibitors to conventional chemotherapy increases antitumor activity in ARID1A-deficient cancer cells.
Notes: (A) 5-FU (10 μmol/L) or cisplatin (10 μmol/L) was applied to MKN-28 and KATO-III cells in the presence of a minimal drug concentration of GSK690693 (0.01 μmol/L). Compared with single agent alone, addition of GSK690693 to the conventional chemotherapy induced more decreased cell viability in ARID1A-knockdown MKN-28 and KATO-III cells than in wild-type cells (*P<0.01). (B) GSK690693 in combination with 5-FU or cisplatin induced a significant increase in apoptosis, compared with 5-FU or cisplatin alone in ARID1A-knockdown cells (*P<0.01). **P<0.001.
Abbreviation: 5-FU, 5-fluorouracil.
Abbreviation: 5-FU, 5-fluorouracil.