
Figures & data
Figure 1 The inhibition of ixazomib on the proliferation of SW620 cells.
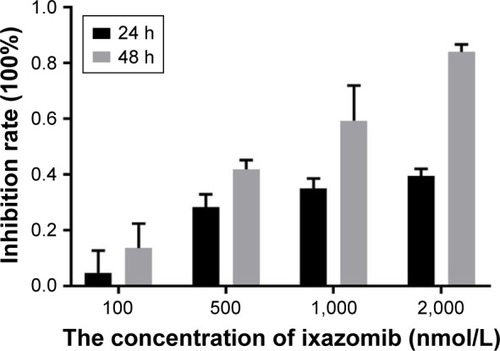
Figure 2 The alterations of gene expression profile.
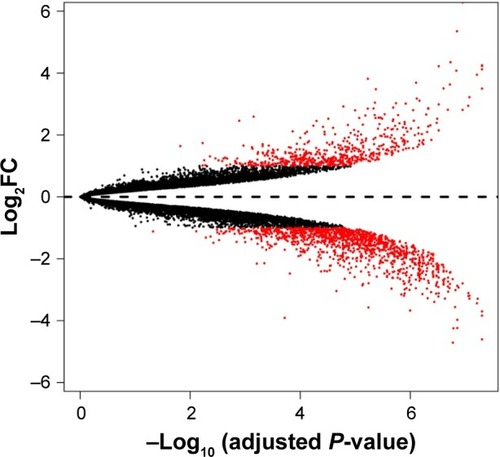
Table 1 The identified top 10 upregulated and downregulated DEGs between ixazomib-treated and untreated samples
Figure 3 Heatmap overview of the hierarchical clustering analysis.
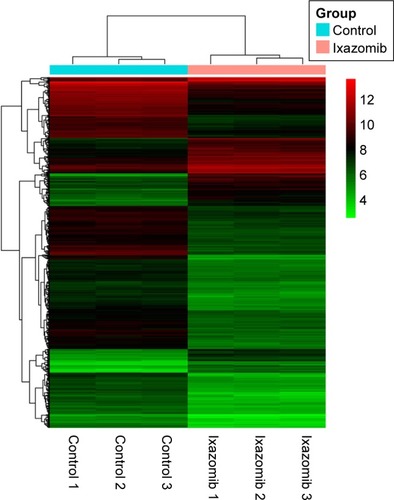
Table 2 Top 35 predominant BP terms and all the eight CC terms and MF terms in GO functional enrichment analysis
Figure 4 The KEGG pathway of apoptosis.
Abbreviations: ADP, adenosine diphosphate; CTLs, cytotoxic T lymphocytes; KEGG, Kyoto Encyclopedia of Genes and Genomes; MOMP, mitochondrial outer membrane permeabilization; NF-κB, nuclear factor-κB; NK, natural killer.
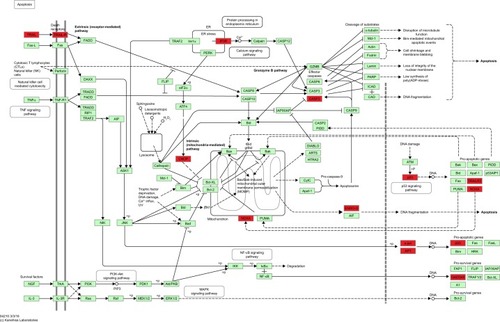
Table 3 The top 25 significantly enriched KEGG pathways of DEGs
Figure 5 Protein–protein interaction network.
Abbreviation: log2FC, log2fold change.
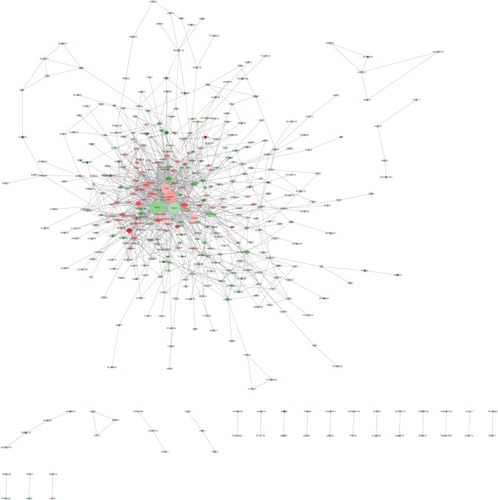
Table 4 Hub genes in the PPI network
Figure 6 The significant modules in the protein–protein interaction network with MCODE score ≥5 and nodes ≥5.
Abbreviations: log2FC, log2fold change; MCODE, Molecular Complex Detection.
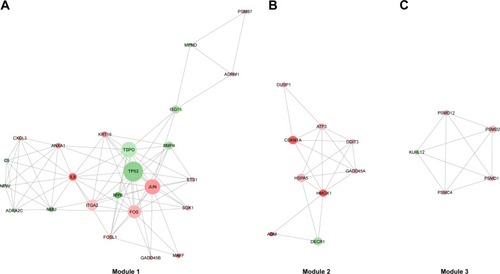
Table S1 The rest 32 BP terms in GO functional enrichment analysis
Table S2 The GO BP functional analysis of Module 1
Table S3 The GO BP functional analysis of Module 2
Table S4 The GO BP functional analysis of Module 3