Figures & data
Table 1 Patient clinical information
Figure 1 Adverse effects of the two treatment.
Note: The adverse effects observed were classified as Grade 1, and their incidence rate was not significantly different between the two groups (P>0.05).
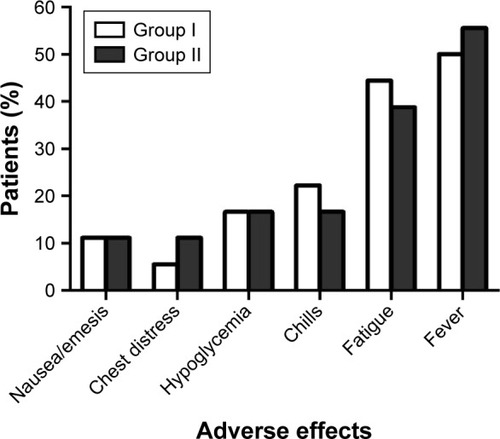
Table 2 Comparison of immune function between the two groups
Figure 2 Changes in the CTC level before treatment and 2 months after treatment.
Notes: (A) Changes in the CTC levels in group I were not significant (P>0.05). (B) The CTC level in group II decreased significantly at 2 months after treatment (P<0.01). **P<0.01.
Abbreviation: CTC, circulating tumor cell.
Abbreviation: CTC, circulating tumor cell.
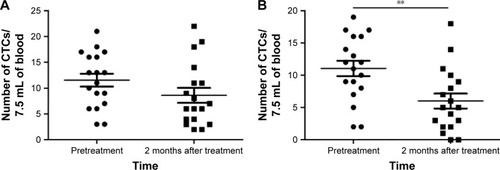
Figure 3 Flow cytometry images of a 53-year-old patient in group II.
Notes: (A) The CTC number of the patient was 21 before treatment. (B) After treatment, the CTC number reduced to 9.
Abbreviations: APC, allophycocyan; CTC, circulating tumor cell; FITC, fluorescein isothiocyanate; PE, phycoerythrin.
Abbreviations: APC, allophycocyan; CTC, circulating tumor cell; FITC, fluorescein isothiocyanate; PE, phycoerythrin.
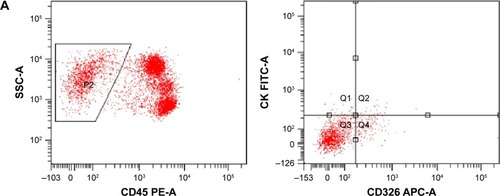
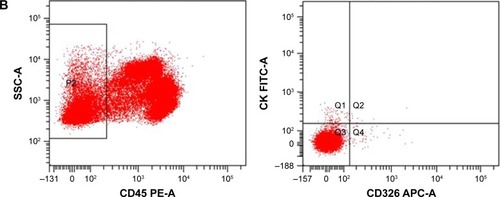
Figure 4 CT images of a 46-year-old patient with breast cancer.
Notes: (A) CT scan of the patient showing a soft tissue mass (8.0×3.8×5.7 cm) with ill-defined margins in the right breast. Enhanced CT demonstrated moderate heterogeneous enhancement of the mass. There are many swollen lymph nodes in armpit, and the larger ones are about 2.9×1.7×3.8 cm. (B) At 2 months after treatment, the size of mass reduced to 6.8×3.5×5.8 cm with mild heterogeneous enhancement. The larger swollen lymph node was shrunk obviously. The red arrows indicate the tumor.
Abbreviation: CT, computed tomography.
Abbreviation: CT, computed tomography.
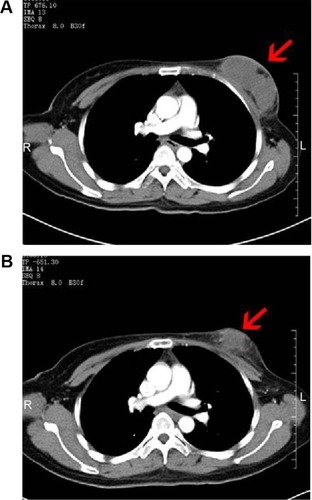
Table 3 Maximum transverse diameter and CT value of the lesions before and after treatment
Table 4 Comparison of the curative effect between the two groups at 2 months post-treatment
Figure 5 Changes in the KPS.
Notes: (A)The KPS at 2 months after treatment exhibited significant improvement compared to the score before treatment in both groups. (B) The KPS was significantly greater in group II than in group I after treatment. *P<0.05.
Abbreviation: KPS, Karnofsky performance status.
Abbreviation: KPS, Karnofsky performance status.
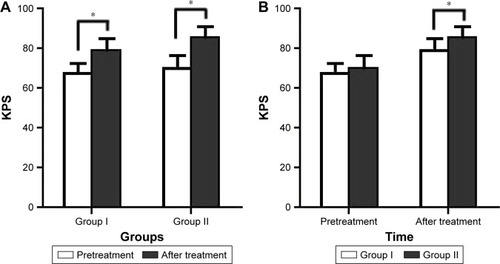
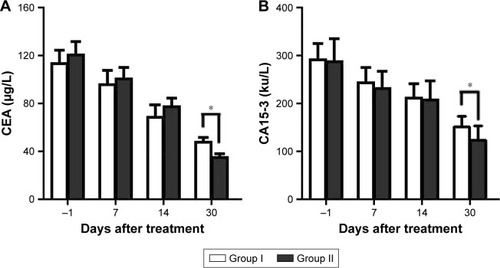
Figure 6 Changes in the biochemical indicators.
Notes: (A) The expression of CEA was lower in group II than in group I at 1 month after treatment. (B) The expression of CA15-3 was lower in group II than in group I at 1 month after treatment. *P<0.05.
Abbreviations: CA15-3, cancer antigen 15-3; CEA, carcinoembryonic antigen.
Abbreviations: CA15-3, cancer antigen 15-3; CEA, carcinoembryonic antigen.