
Figures & data
Table 1 Clinical characteristics of the participants
Figure 1 Characterization of exosomes isolated from the serum of HCC patients.
Notes: (A) Western blot analysis of the expression of proteins enriched in exosomes, including CD63 and CD9. As the control, GAPDH was not detected in exosomes. (B) Transmission electron microscopy analysis of the morphology of exosomes (scale bar: 200 nm). (C) Nanoparticle tracking analysis to quantify the size and concentration of exosomes.
Abbreviation: HCC, hepatocellular carcinoma.
Abbreviation: HCC, hepatocellular carcinoma.
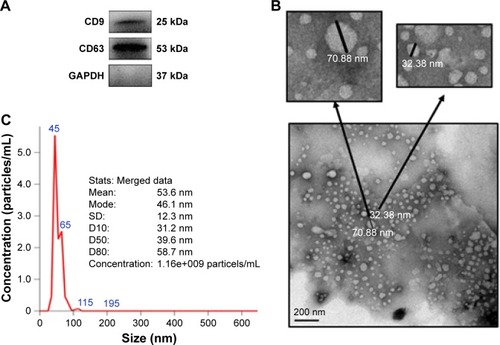
Figure 2 The relative expression of miR-125b in the subjects.
Notes: (A) qRT-PCR was performed to measure miR-125b levels in exosomes, the whole serum, and exosome-depleted supernatant from patients of cohort 1, including CHB (n=30), LC (n=30), and HCC (n=30). (B) miR-125b relative expression in exosomes and the whole serum was detected in HCC patients of cohort 1 (n=30) and 2 (n=128). ** P<0.01.
Abbreviations: qRT-PCR, quantitative real-time polymerase chain reaction; CHB, chronic hepatitis B; LC, liver cirrhosis; HCC, hepatocellular carcinoma; NS, not significant.
Abbreviations: qRT-PCR, quantitative real-time polymerase chain reaction; CHB, chronic hepatitis B; LC, liver cirrhosis; HCC, hepatocellular carcinoma; NS, not significant.
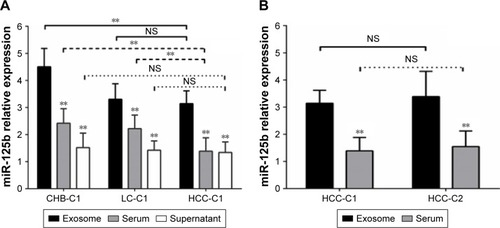
Figure 3 Kaplan–Meier analysis of cumulative recurrence and overall survival in HCC patients.
Notes: After operation (n=128; cohort 2) according to miR-125b expression in exosomes (A and B) and serum (C and D). P-values were calculated by the log-rank test and P<0.05 denoted significance.
Abbreviation: HCC, hepatocellular carcinoma.
Abbreviation: HCC, hepatocellular carcinoma.
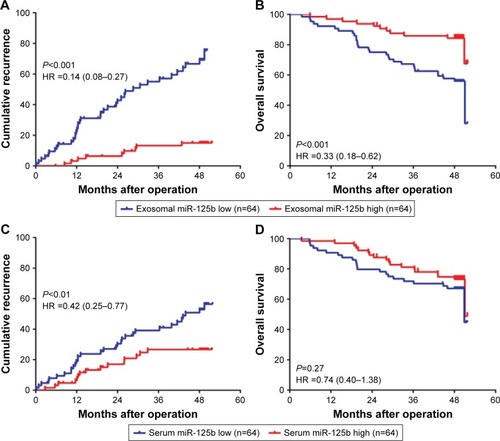
Table 2 Correlation between miR-125b expression and clinical characteristics of HCC (cohort 2, n=128)
Table 3 Univariate and multivariate analysis of prognostic factors in HCC (cohort 2, n=128)
Figure 4 ROC curve analysis for MVI and exosomal miR-125b in HCC patients (n=128; cohort 2).
Notes: ROC curves for predicting the recurrence of MVI (A), exosomal miR-125b (B), and combination of exosomal miR-125b and MVI (C). ROC curves for predicting the survival of MVI (D), exosomal miR-125b (E), and combination of exosomal miR-125b and MVI (F).
Abbreviations: MVI, microvascular invasion; HCC, hepatocellular carcinoma; AUC, area under the ROC curve.
Abbreviations: MVI, microvascular invasion; HCC, hepatocellular carcinoma; AUC, area under the ROC curve.
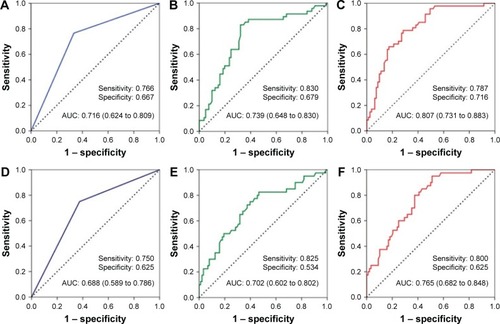
Table 4 ROC curve analysis for predicting prognostic accuracy of recurrence in HCC patients (cohort 2; n=128)