
Figures & data
Table 1 Patient characteristics
Figure 1 Examples of target delineation for GTV after induction chemotherapy.
Notes: (A) A-pre presents the tumor (green line) before induction chemotherapy (IC); A-post shows that the regressing part of the intracavitary lesion after IC was not included in GTV (red line). (B) B-pre presents the extension of tumor (green line) before IC; B-post shows that involved tissues (eg, pterygopalatine fossa) were included in GTV (red line) regardless of the regression. (C) C-pre presents the positive lymph node (green line) before IC; C-post shows that the GTV of lymph node (red line) was based on the post-IC volume.
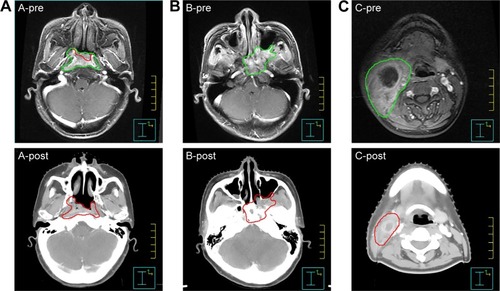
Figure 2 Univariate analysis of patients with local OR and without local objective response (non-OR) after induction chemotherapy on local failure-free survival.
Abbreviation: OR, objective response.
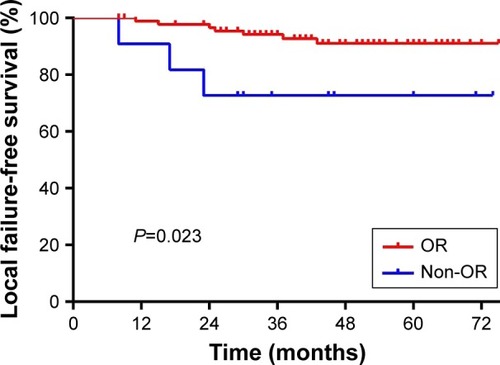
Table 2 Dosimetric parameters of the target volumes in the nasopharynx
Table 3 Average dose to the neurological OARs and proportion of patients not fulfilling dosimetric constraints