Figures & data
Table 1 Primer sequences of ABCA2, ABCA3 and GAPDH
Figure 1 Results obtained by RT-PCR amplification of ABCA2 and ABCA3 in a representative selection of ALL patients.
Notes: Real-time PCR was performed in triplicate for each sample. To confirm the purity and correct size of the qRT-PCR products, the target and the housekeeping GAPDH gene, random amplicons were loaded on an agarose gel. The gel was stained with ethidium bromide and photographed.
Abbreviations: ABC, ATP-binding cassette; ALL, acute lymphoblastic leukemia; GAPDH, glyceraldehyde 3-phosphate dehydrogenase; M, molecular weight marker; NTC, nontemplate control; PCR, polymerase chain reaction; qRT-PCR; quantitative reverse transcriptase PCR.
Abbreviations: ABC, ATP-binding cassette; ALL, acute lymphoblastic leukemia; GAPDH, glyceraldehyde 3-phosphate dehydrogenase; M, molecular weight marker; NTC, nontemplate control; PCR, polymerase chain reaction; qRT-PCR; quantitative reverse transcriptase PCR.
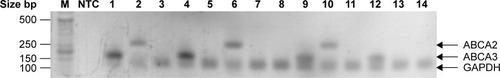
Figure 2 ABCA2 and ABCA3 protein expression of samples with a high ABCA2/ABCA3 mRNA expression.
Notes: Mononuclear cell lysis and extraction of total protein was performed on blood samples of de novo ALL patients with high expression of ABCA2 and ABCA3 at mRNA levels compared to controls. Accordingly, 21.5 μg of the extracted protein was loaded into the wells and Western blotting was performed following SDS-PAGE using goat anti-human ABCA2 and ABCA3 polyclonal antibodies, respectively. PVDF membranes were treated with related secondary antibody and exposed to ECL solution. Out of 12 MRD+ patients, seven showed visible bands corresponding to high expression levels of ABCA3 protein with an MWt of 191 kDa, and five showed visible bands corresponding to high expression levels of ABCA2 protein with an MWt of 270 kDa. One MRD patient (patient number 11) showed high expression levels of ABCA3. Each lane corresponds to an individual ABCA2 or ABCA3 mRNA+ patient and is labeled by numbers. Probing the blots with mouse anti-human GAPDH monoclonal antibody showed identical amounts of loaded proteins. P indicates a pool of 12 control samples.
Abbreviations: ECL, enhanced chemiluminescence; GAPDH, glyceraldehyde 3-phosphate dehydrogenase; MRD, minimal residual disease; MWt, molecular weight; PVDF, polyvinylidene difluoride; SDS-PAGE, sodium dodecyl sulfate polyacrylamide gel electrophoresis.
Abbreviations: ECL, enhanced chemiluminescence; GAPDH, glyceraldehyde 3-phosphate dehydrogenase; MRD, minimal residual disease; MWt, molecular weight; PVDF, polyvinylidene difluoride; SDS-PAGE, sodium dodecyl sulfate polyacrylamide gel electrophoresis.
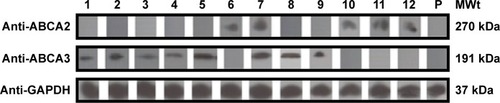
Table 2 The expression profiles of ABCA2 and ABCA3, separately (A, B) and together (C) at the mRNA and protein levels in 69 patients with de novo ALL
Figure 3 Tertiary structures of ABCA2 and ABCA3.
Notes: (A) Comparative structural analysis of ABCA2 (purple) and ABCA3 (yellow) models predicted by Phyre2 showed close similarity. (B) ABCA3 model obtained by I-TASSER ab initio method (orange) and the water molecules (cyan) within the active site. (C) ABCA2 active site used for grid calculations and docking analysis. ABCA2 model (yellow), ABCA2 molecular surface (green), water molecules (cyan) and ABCA2 active site (gray box).
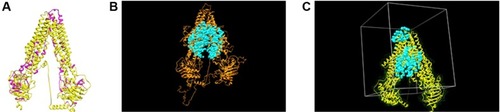
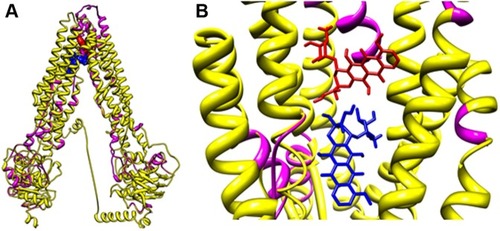
Figure 4 Molecular docking analyses of ABCA2/A3 models shown in zoomed out (A) and zoomed in (B) images.
Notes: Doxorubicin is depicted as a representative ALL antineoplastic drug and colored arbitrarily according to the heteroatom. ABCA2 (purple); ABCA3 (yellow).
Abbreviation: ALL, acute lymphoblastic leukemia.
Abbreviation: ALL, acute lymphoblastic leukemia.