
Figures & data
Table 1 Clinicopathological characteristics of patients
Figure 1 Kaplan–Meier survival curves for overall survival in 216 osteosarcoma patients according to (A) CRP/Alb ratio, (B) NLR, (C) PLR, and (D) the GPS.
Abbreviations: CRP/Alb ratio, C-reactive protein to albumin ratio; GPS, Glasgow prognostic score; NLR, neutrophil to lymphocyte ratio; PLR, platelet to lymphocyte ratio.
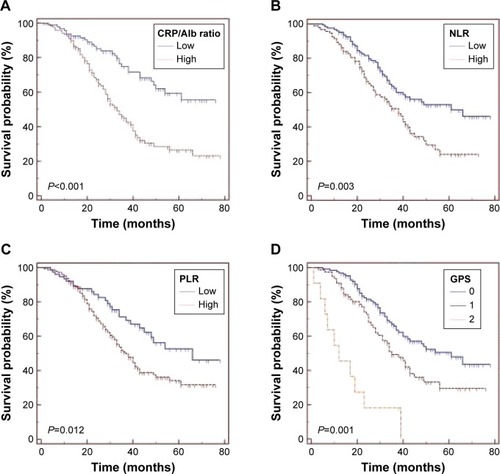
Table 2 Univariate and multivariate analyses of overall survival using the Cox proportional hazard model
Figure 2 Comparison of the areas under the ROC curves for prognosis among the inflammation-based prognostic indicators.
Abbreviations: CRP/Alb ratio, C-reactive protein to albumin ratio; GPS, Glasgow prognostic score; NLR, neutrophil to lymphocyte ratio; PLR, platelet to lymphocyte ratio; ROC, receiver operating characteristic.
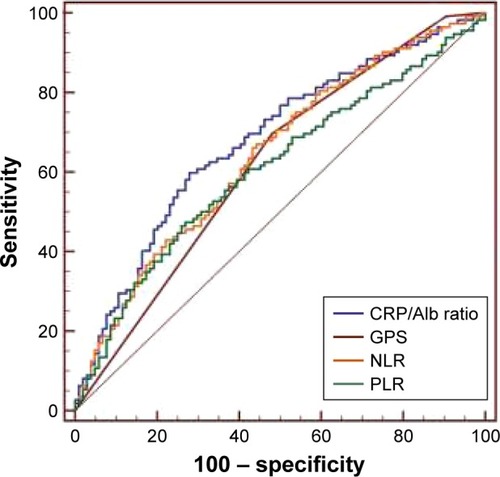
Table 3 Comparison of the AUCs between inflammation-based prognostic indicators