
Figures & data
Table 1 Clinicopathological characteristics and outcomes of 262 patients who were diagnosed with clinical early-stage tongue cancer (cT1/T2N0)
Figure 1 Receiver operating characteristic curve of (A) NLR and (B) LND for predicting the survival of early-stage tongue cancer patients with AUC equal to 68.1% and 86.9%, respectively.
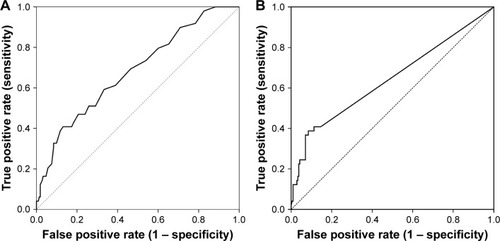
Figure 2 Kaplan–Meier analysis of patients with early-stage tongue cancer, by NLR with cutting in 2.95.
Abbreviations: OS, overall survival; DSS, disease-specific survival; DFS, disease-free survival; NLR, neutrophil-to-lymphocyte ratio.
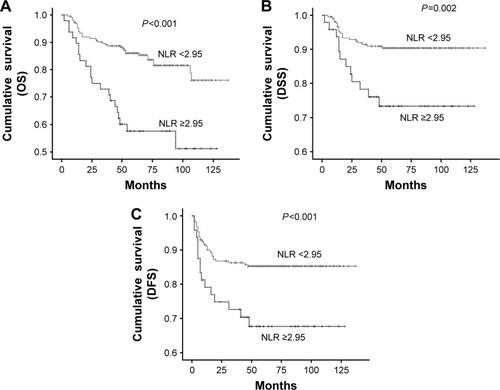
Table 2 Association analysis between NLR and other clinical/pathological factors
Figure 3 Kaplan–Meier analysis of patients with early-stage tongue cancer, by LND with cutting in 0.031.
Abbreviations: OS, overall survival; DSS, disease-specific survival; DFS, disease-free survival; LND, lymph node density.
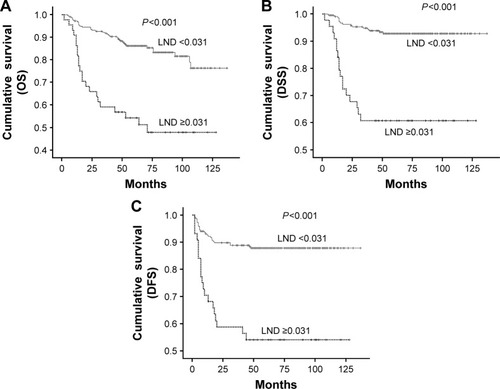
Table 3 Univariate survival analysis of prognostic factors
Table 4 Multivariate analysis of prognostic factors for 5-year overall survival
Table 5 Multivariate analysis of prognostic factors for 5-year disease-specific survival
Table 6 Multivariate analysis of prognostic factors for 5-year disease-free survival
Table 7 Different studies about the lymph node density in head and neck cancer
Table 8 Different studies about neutrophil-to-lymphocyte ratio in head and neck cancer