Figures & data
Figure 1 CD133+ LC cells possess the characteristics of LC CSCs. (A and C) RT-PCR analysis of mRNA level in LC cells normalized to β-actin. The CSC-related genes of the CD133+ or CD133− LC cells were analyzed. The percentages of CD133+ cells in A549 CD133+ and A431 CD133+ cells were 99.1%±0.4% and 98.8%±0.4%, respectively. (B and D) CD133+ LC cells generated more tumorspheres than CD133− LC cells. The percentages of CD133+ cells in A549 CD133+ and A431 CD133+ cells were 99.6%±0.2% and 98.5%±0.3%, respectively. The phase-contrast image was a representative tumorsphere. Scale bars represent 50 μm. The two groups of CD133+ and CD133− LC cells are compared by Student’s nonpaired t-test. *P<0.05; **P<0.01; ***P<0.001. Data are expressed as mean ± SD (n=3).
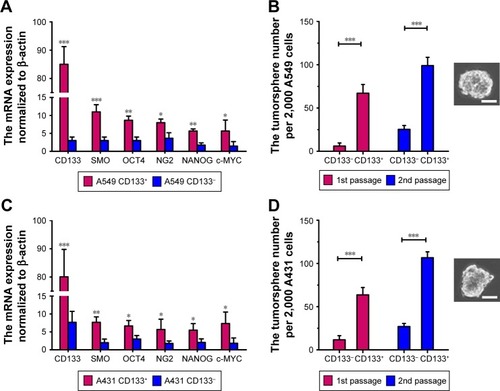
Table 1 The in vivo tumorigenic potential of CD133+ and CD133− LC cells in miceTable Footnotea
Figure 2 The preparation of salinomycin-NPs and gefitinib-NPs. Salinomycin-NPs or gefitinib-NPs was prepared by using an emulsion/solvent evaporation method. PLGA-PEG and salinomycin or gefitinib were dissolved in dichloromethane. The solution was added to 1.5% sodium cholate solution. The mixture was sonicated, and the emulsion was added to 0.5% sodium cholate before evaporating dichloromethane. The nanoparticles were collected by centrifugation.
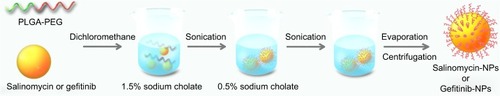
Table 2 Characteristics of nanoparticlesTable Footnotea
Figure 3 The morphology of nanoparticles observed by TEM and the drug release of nanoparticles. (A and B) TEM. The nanoparticles were stained by 2% PTA and visualized under the TEM. Scale bar represents 100 nm. (C and D) The in vitro release of salinomycin or gefitinib from the nanoparticles in PBS and plasma, respectively. The drug release in PBS and plasma groups are compared by Student’s nonpaired t-test. *P<0.05. Data are expressed as mean ± SD (n=3).
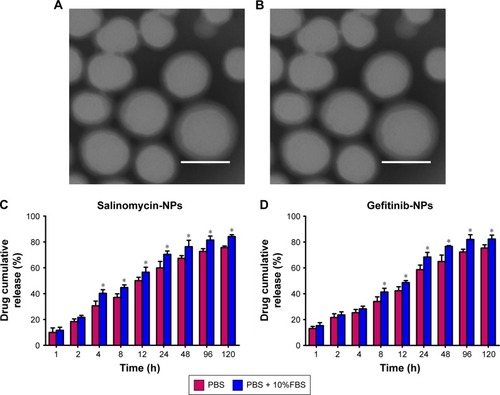
Figure 4 The cytotoxic effect of the free drugs and nanoparticles against the cells was measured by the CCK-8 assay. (A) CD133+ A549 cells, (B) CD133− A549 cells, (C) CD133+ A431 cell, (D) CD133− A431 cells. Data are expressed as mean ± SD (n=3).
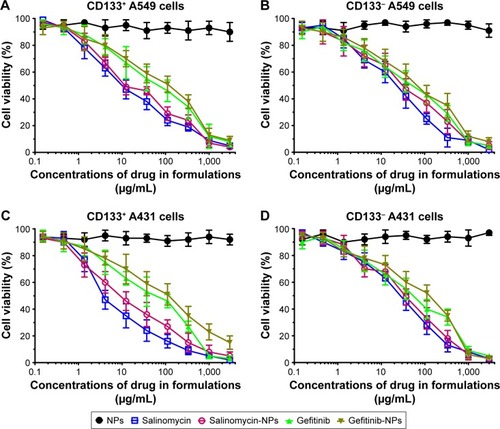
Table 3 The cell proliferation assay of drugs at 72 hoursTable Footnotea
Figure 5 The effect of nanoparticles or free drugs on the proportion of CSCs in LC cells was evaluated by the tumorsphere formation assay (A and C) and the proportion of CD133+ cells (B and D). The extent of tumorsphere formation and the proportion of CD133+ cells were examined after the treatment of A549 cells (A and B) and A431 cells (C and D). The tumorsphere formation rate of the untreated group is used as a control (the rate is defined as 100%). The groups are compared with the untreated control by one-way ANOVA with the Dunnett’s posttest. *P<0.05; **P<0.01; ***P<0.001. Data are expressed as mean ± SD (n=6).
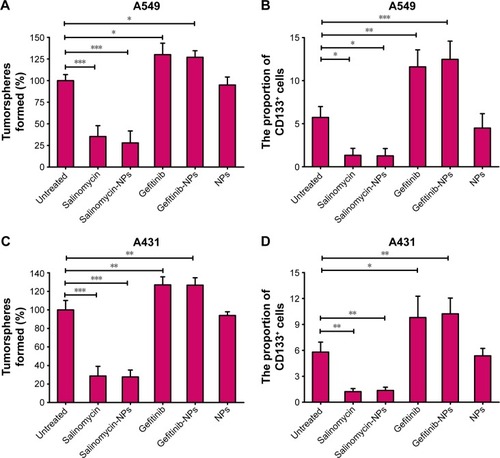
Figure 6 In vivo antitumor activity in mice. Mice were treated with intravenous injections of the nanoparticles or free drugs via tail vein (5 mg salinomycin/kg, 30 mg gefitinib/kg). The drugs were given once every 3 days for 10 times on days 5, 8, 11, 14, 17, 20, 23, 24, 27, and 30 (indicated by black arrows). (A) The tumor growth curve. (B) Images of one representative tumor of each group at the end point. Green dashed lines are used to emphasize the tumors. (C) The excised tumors were weighted at the end point. The tumor weight of the salinomycin-NPs combined with gefitinib-NP-treated group is compared with that of other groups by one-way ANOVA with the Dunnett’s posttest. **P<0.01; ***P<0.001. Data are expressed as mean ± SD (n=8). On day 33, three mice were euthanized, and the tumors were excised. The effect of the drugs on the CSC proportion of A431 tumors in vivo was evaluated by the tumorsphere formation (D) and the proportion of CD133+ cells (E) of the cells from the excised tumors. The tumorsphere formation rate of the untreated group is used as a control (the rate is defined as 100%). The groups are compared with the saline-treated control by one-way ANOVA with the Dunnett’s posttest. **P<0.01; ***P<0.001. Data are expressed as mean ± SD (n=3). (F) The weight change of the mice during the treatment. The body weight of the mice was monitored once every 5 days. Data are expressed as mean ± SD (n=8).
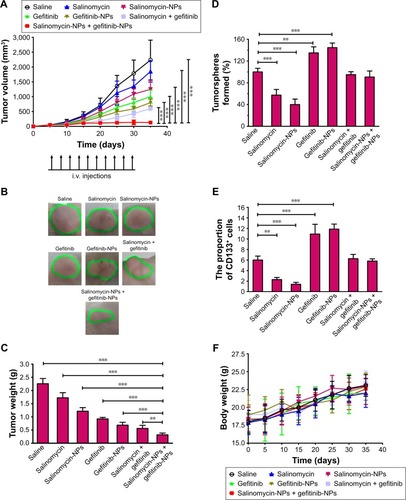
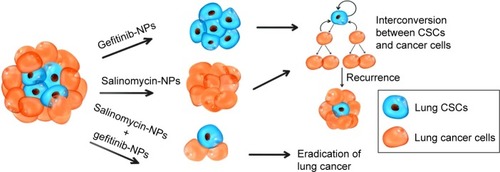
Figure 7 The mechanism underlying the antitumor activity of the combination therapy of salinomycin-NPs combined with gefitinib-NPs. Though gefitinib-NPs could efficiently eliminate LC cells, LC CSCs is resistant to gefitinib-NPs and remain intact. Thus, the recurrence of LC usually ensues. On the other side, due to plasticity in the LC cancer cell population (ie, LC cells could be converted into LC CSCs in special circumstances), relapse can also occur if only LC CSCs have been targeted by salinomycin-NPs. The combination therapy of salinomycin-NPs combined with gefitinib-NPs could lead to the eradication of LC.