
Figures & data
Table 1 Tumor characteristics and surgical results for all patients
Figure 1 (A) DNA index distribution in the 53 patients with peritoneal carcinomatosis from ovarian cancer. The DNA index of all the cell populations present in the sample was considered for multiploid tumors (light gray bars). (B) Representative flow cytometric histogram plots of two samples and DNA diploid internal control.
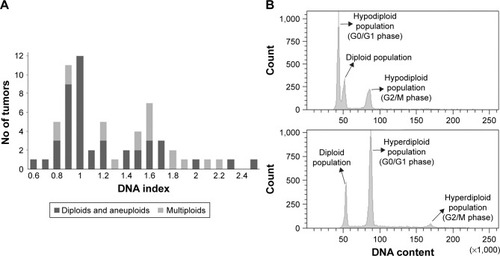
Table 2 Association between ploidy and clinical pathological variables in peritoneal carcinomatosis
Figure 2 Box plot showing the distribution of SPF values depending on ploidy. P<0.05 was considered significant.
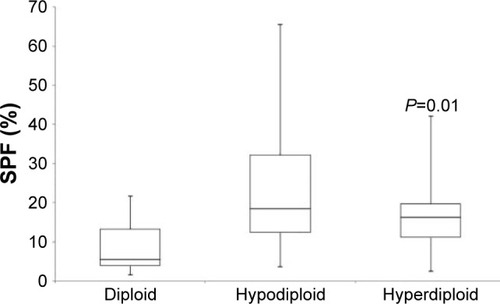
Table 3 Association between SPF and clinical pathological variables
Figure 3 Kaplan–Meier plots of overall survival according to analysis of (A) ploidy status and (B) SPF at cut-off of 14.9%. The significance level (P) was determined by log-rank test.
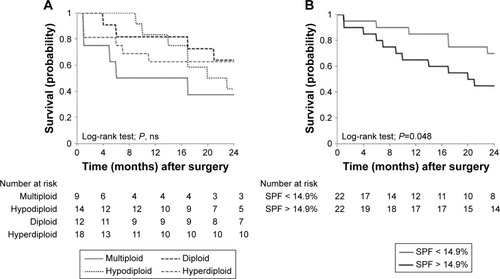
Table 4 In vitro sensitivity (%) of the different ploidy subgroups to all tested drugs