Figures & data
Figure 1 Effect of SD1029 on POMC mRNA and adrenocorticotropic hormone (ACTH) levels in AtT20 cells.
Notes: Cell-culture treatments were conducted in triplicate, and the averages of three independent experiments are shown (the average of triplicates was considered as n=1, in this experiment n=3). One-way ANOVA was conducted, followed by Fisher’s protected least significant difference post hoc test to determine differences between treatment means (*P<0.05 compared with control [C]). (A) Time-dependent effect of SD1029 on POMC mRNA levels; cells were incubated with medium containing 10 µM SD1029. (B) Dose-dependent effects of SD1029 on POMC mRNA levels; cells were incubated for 24 hours with medium containing between 100 nM and 10 µM SD1029. (C) Dose-dependent effects of SD1029 on ACTH levels in AtT20 cells; cells were incubated for 24 hours with medium containing between 100 nM and 10 µM SD1029.
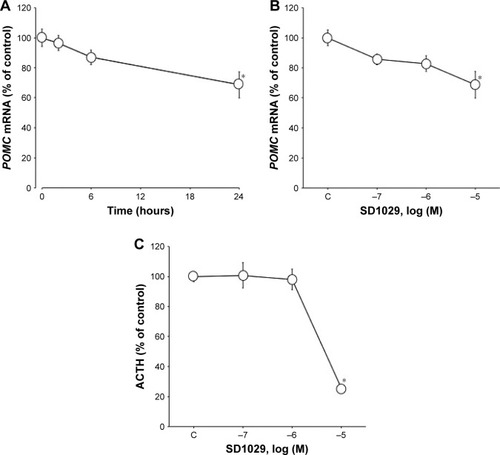
Figure 2 Effect of SD1029 on the proliferation and death of AtT20 cells.
Notes: Cell-culture treatments were conducted in triplicate, and the averages of three independent experiments are shown. One-way ANOVA was conducted, followed by Fisher’s protected least significant difference post hoc test to determine differences between treatment means (*P<0.05 compared with control [C]). (A) Effect of SD1029 on the proliferation of AtT20 cells; cells were incubated for 48 hours with medium containing between 100 nM and 10 µM SD1029. Viable cells were measured using Cell Counting Kit 8. (B) Effect of SD1029 on cell death in AtT20 cells; cells were incubated for 24 hours with medium containing between 100 nM and 10 µM SD1029. DNA fragmentation was assayed using a cell-death detection enzyme-linked immunosorbent-assay kit.
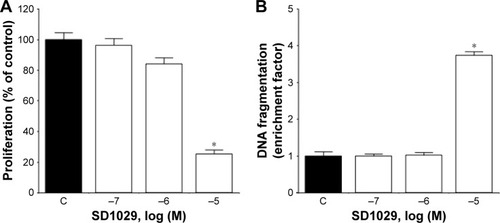
Figure 3 Effect of SD1029 on the cell-cycle profile of AtT20 cells.
Notes: Control cells were treated with the medium and vehicle. Representative graphs are shown in the upper panels. Duplicate cell treatments were conducted, and the average of three independent experiments is shown in the lower panel. Unpaired Student’s t-tests were conducted to determine differences between treatment means. Cells were incubated for 24 hours with 10 µM SD1029 (SD) or the dimethyl sulfoxide control (C). Cellular DNA content was analyzed by flow cytometry, and cell-cycle profiles were determined using BD FACSDiva software.
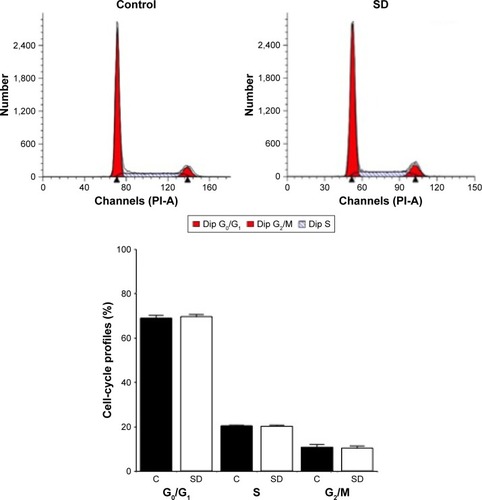
Figure 4 Effect of SD1029 on PTTG1 and GADD45β mRNA levels in AtT20 cells.
Notes: Triplicate cell treatments were conducted, and the average of three independent experiments is shown. One-way ANOVA was conducted, followed by Fisher’s protected least significant difference post hoc test to determine differences between treatment means (*P<0.05 compared with control [C]). (A, C) Time-dependent effect of SD1029 on PTTG1 and GADD45β mRNA levels; cells were incubated with medium containing 10 µM SD1029. (B, D) Dose-dependent effects of SD1029 on PTTG1 and GADD45β mRNA levels; cells were incubated for 24 hours with medium containing between 100 nM and 10 µM SD1029.
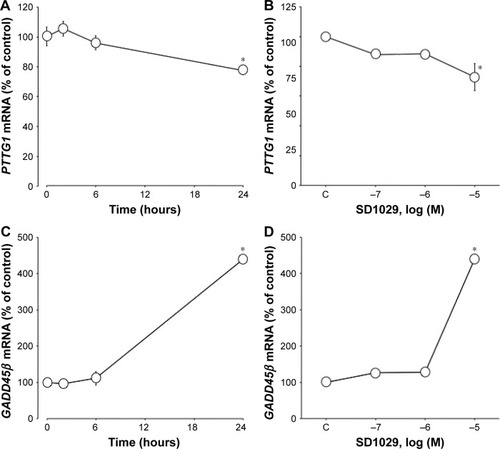
Figure 5 Effect of PTTG1 and GADD45β on POMC mRNA levels and proliferation in AtT20 cells.
Notes: Cell treatments were conducted in triplicate, and the average of three independent experiments is shown. One-way ANOVA was conducted, followed by a Fisher’s protected least significant difference post hoc test to determine differences between treatment means (*P<0.05 compared with control). (A) Effect of PTTG1 on POMC mRNA levels; cells were seeded in 12-well plates at a density of 12×104 cells/well and incubated for 48 hours in 1 mL of culture medium containing control or PTTG1-specific siRNA (siPTTG1). (B) Effect of PTTG1 on cell proliferation; cells were seeded in 96-well plates at a density of 1.5×10⁴ cells/well and incubated for 48 hours in 200 µL of culture medium containing control siRNA or siPTTG1. (C) Effect of GADD45β on POMC mRNA levels; cells were seeded in 12-well plates at a density of 12×104 cells/well and incubated for 48 hours in 1 mL of culture medium containing control or GADD45β-specific siRNA (siGADD45β). (D) Effect of GADD45β on cell proliferation; cells were seeded in 96-well plates at a density of 1.5×10⁴ cells/well and incubated for 48 hours in 200 µL of culture medium containing control siRNA or siGADD45β. The symbols “+” and “−” mean culture medium with and without the material, respectively.
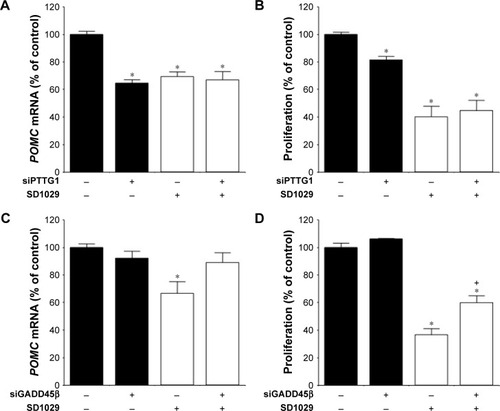
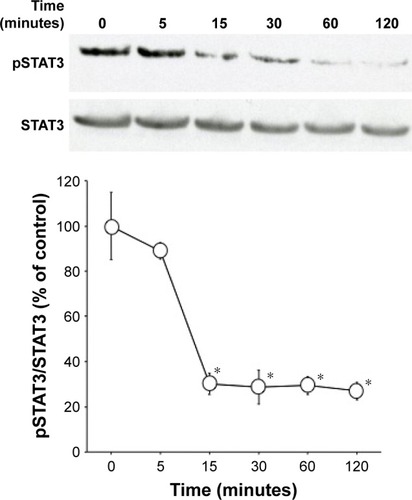
Figure 6 Time-dependent changes in SD1029-induced STAT3 phosphorylation.
Notes: AtT20 cells were incubated with medium containing 10 µM SD1029 for the durations shown. Cells treatments were conducted in duplicate, and the average of three independent experiments is shown. One-way ANOVA was conducted, followed by Fisher’s protected least significant difference post hoc test to determine differences between treatment means (*P<0.05 compared with control [0 minutes]).