Figures & data
Figure 1 Flow diagram of studies selection process.
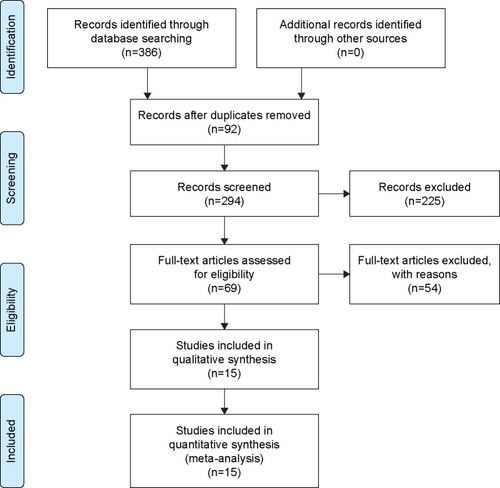
Table 1 Characteristics of included study comparing nimotuzumab combined with three-dimensional radiotherapy for nasopharyngeal carcinoma
Table 2 Methodological quality assessment (risk of bias) of included studies by Newcastle–Ottawa Scale
Figure 2 Forest plot of nimotuzumab combined with concurrent chemoradiotherapy versus chemoradiotherapy alone in advanced NPC.
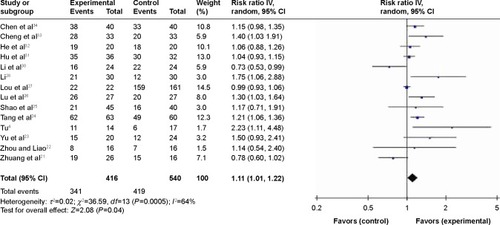
Figure 3 Forest plot of adverse reactions between nimotuzumab group and chemoradiotherapy alone.
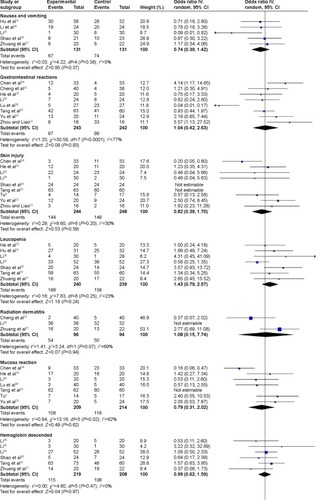
Figure 4 Forest plot of adverse reactions between nimotuzumab group and chemoradiotherapy alone.
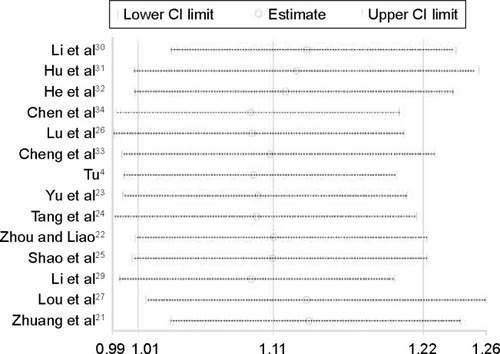
Figure 5 Sensitivity analysis of the pooled estimation.
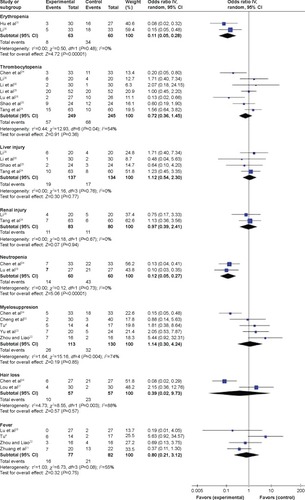
Figure 6 Deek’s funnel plot to evaluate the publication bias.
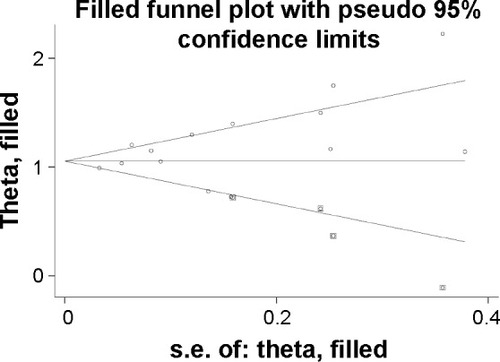
Figure S1 PRISMA checklist.
Notes: Reproduced from Moher D, Liberati A, Tetzlaff J, Altman DG, PRISMA Group. Preferred reporting items for systematic reviews and meta-analyses: the PRISMA statement. PLoS Med. 2009;6(6):e1000097.Citation10 For more information, visit: www.prisma-statement.org.
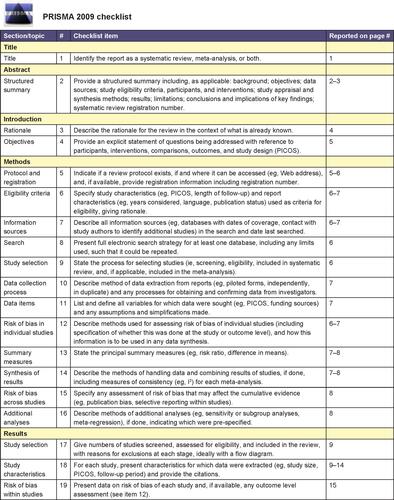
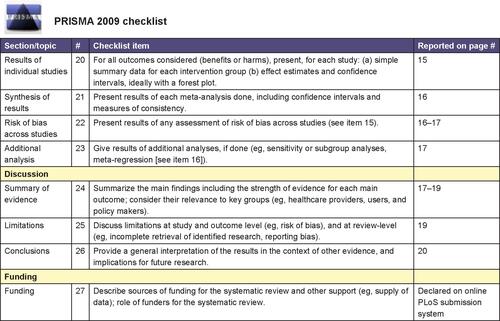
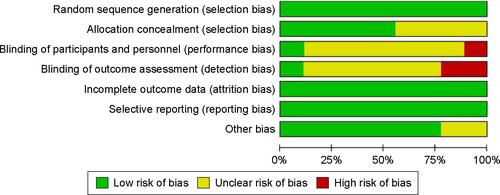
Figure S2 Risk of bias and applicability concerns graph: review authors’ judgments about each domain presented as percentages across included studies.
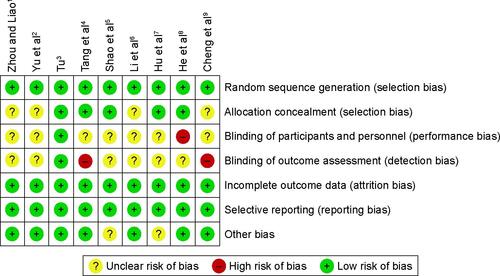
Figure S3 Risk of bias and applicability concerns summary: review authors’ judgments about each domain for each included study.