
Figures & data
Figure 1 Selection flowchart for the meta-analysis.
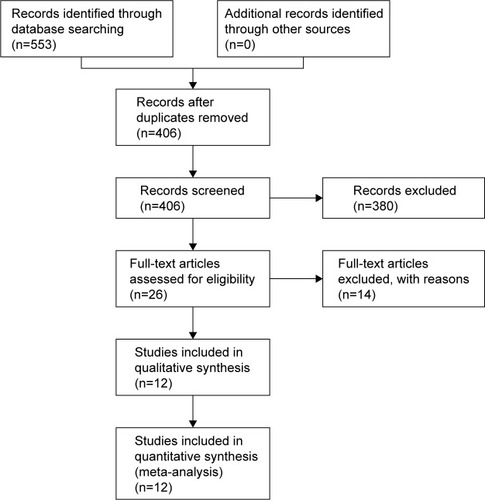
Table 1 Baseline characteristics of the 12 studies included
Table 2 Meta-analysis results of associations of decreased miR-101 expression with clinicopathological parameters
Figure 2 Forest plot of studies evaluating HRs of decreased miR-101 expression for OS.
Abbreviations: HRs, hazard ratios; OS, overall survival.
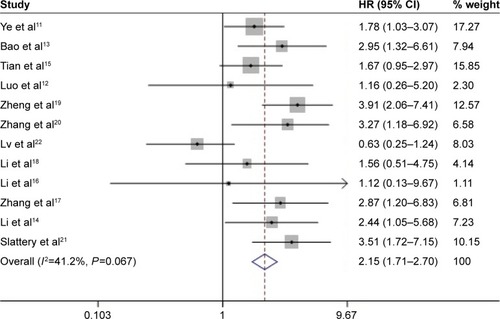
Table 3 Subgroup analysis of decreased miR-101 for OS in solid tumors
Figure 3 Forest plot of studies evaluating HRs of decreased miR-101 expression for DFS/RFS/PFS.
Note: Weights are from random effects analysis.
Abbreviations: DFS, disease-free survival; RFS, recurrence-free survival; PFS, progression-free survival; HR, hazard ratio; OS, overall survival.
Abbreviations: DFS, disease-free survival; RFS, recurrence-free survival; PFS, progression-free survival; HR, hazard ratio; OS, overall survival.
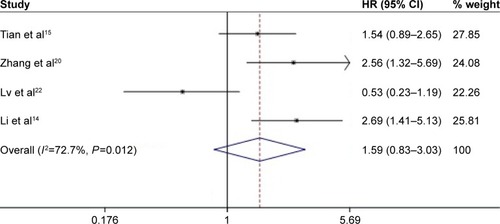
Figure 4 Begg funnel plot for publication-bias test of overall survival.
Abbreviations: HR, hazard ratio; SE, standard error.
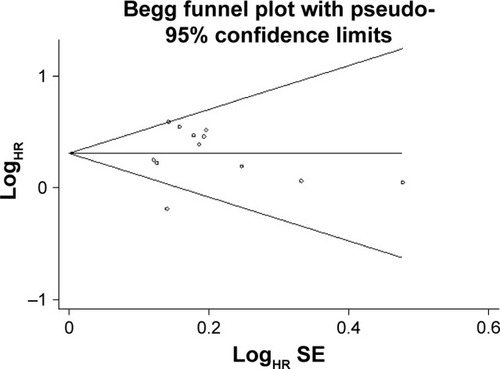
Figure 5 Sensitivity analysis of relationship between decreased miR-101 expression and overall survival in cancers.
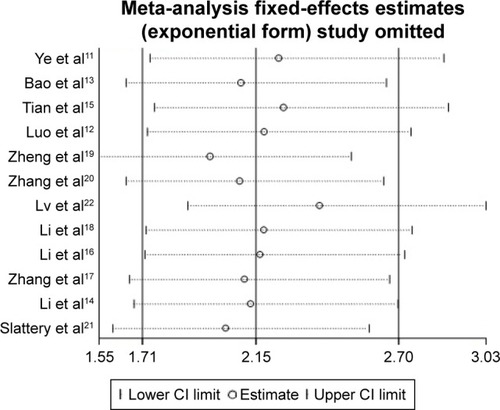
Table 4 Gene targets of miR-101 in this meta-analysis