Figures & data
Table 1 The top 10 DEmRNAs, DEmiRNAs, and DElncRNAs
Figure 1 Cluster dendrogram and color display of the co-expression network modules produced by average linkage hierarchical clustering of genes based on topological overlaps in the DEGs. Each branch in the dendrogram is a line that represents a single gene. Height indicates the Euclidean distance. Each color indicates a single module which contained genes with conservation closely in the data set. The area occupied by each color indicates the number of genes within the respective module.
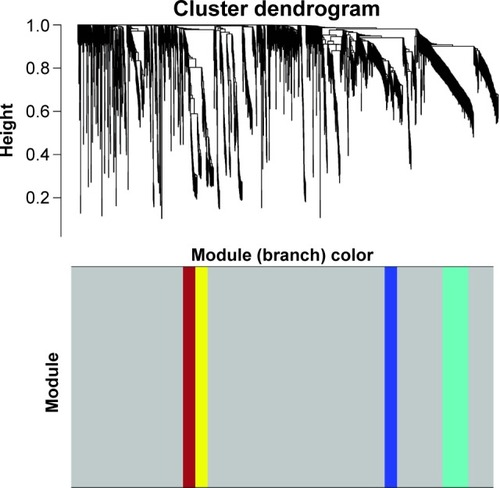
Figure 2 Module–trait relationships. Each row corresponds to a color module and column to clinical features (survival time and survival status). Each cell contains the corresponding relational value (r) in the first line and the P-value in the second line.
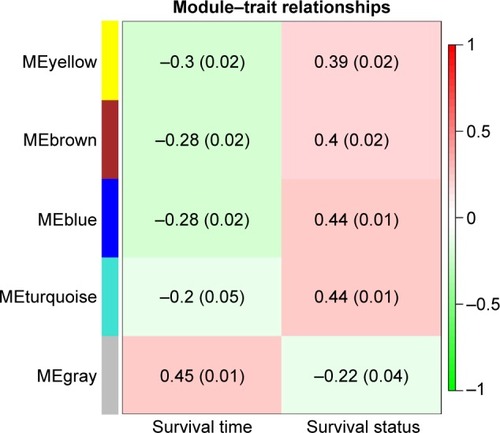
Figure 3 The PPI networks of DEmRNAs built by WGCNA modules in PRCC. Each ellipse corresponds to a protein-coding gene (mRNA). The key DEmRNAs at the core of modules are indicated as round rectangles. The green nodes denote that the genes are downregulated, while the red nodes denote that the genes are upregulated.
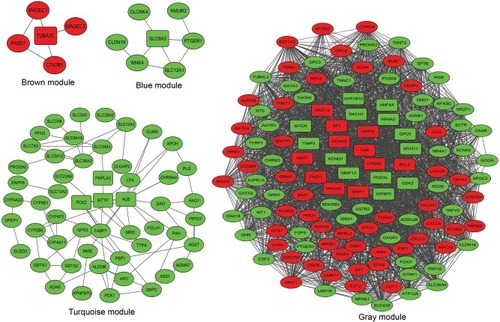
Table 2 The KEGG pathways of WGCNA modules
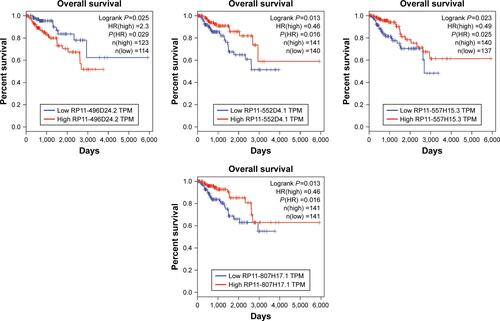
Figure 4 (A) The newly identified ceRNA network in PRCC. lncRNAs, miRNAs, and target mRNAs are indicated as yellow hexagons, red inverted triangles, and purple ellipses, respectively. (B) Kaplan–Meier curve analysis of five DElncRNAs for the overall survival in PRCC patients. High expression of five DElncRNAs, including AC003092.1, PVT1, RP6-191P20.4, RP11-401P9.4, and RP11-496D24.2, was associated with poor prognosis. Horizontal axis stands for overall survival time, while vertical axis stands for survival function.
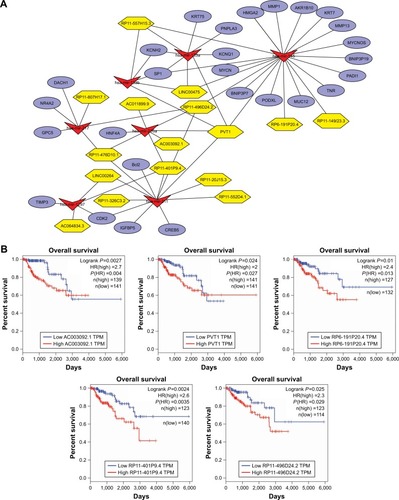
Table 3 The DElncRNAs, DEmiRNAs, and DEmRNAs preserved in ceRNA network
Figure 5 Kaplan–Meier curve analysis of all DEmiRNAs for the overall survival in PRCC patients. Survival analysis of seven miRNAs exhibited that all DEmiRNAs except mir-211 revealed negative effects on patient overall survival. Horizontal axis stands for overall survival time, while vertical axis stands for survival function.
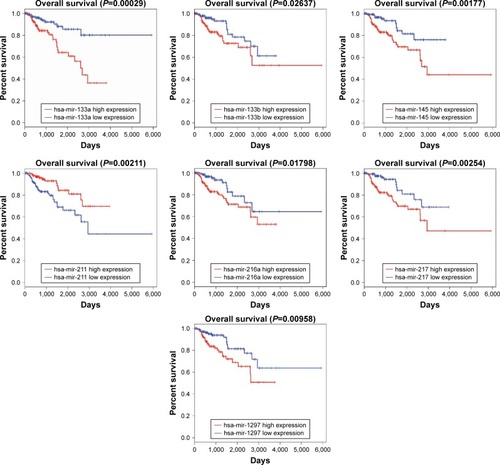
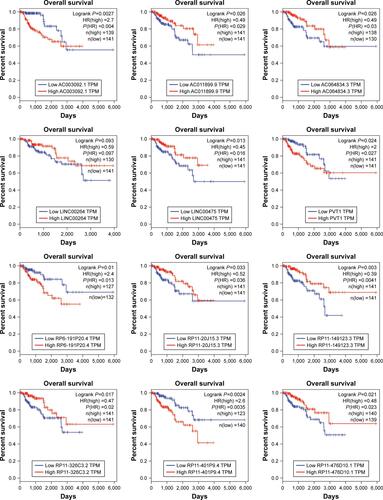
Figure S1 Kaplan–Meier curve analysis of all DElncRNAs for the overall survival in PRCC patients.
Abbreviations: DElncRNAs, differentially expressed lncRNAs; PRCC, papillary renal cell carcinoma.