Figures & data
Figure 1 Flow chart showing selection of studies for meta-analysis.
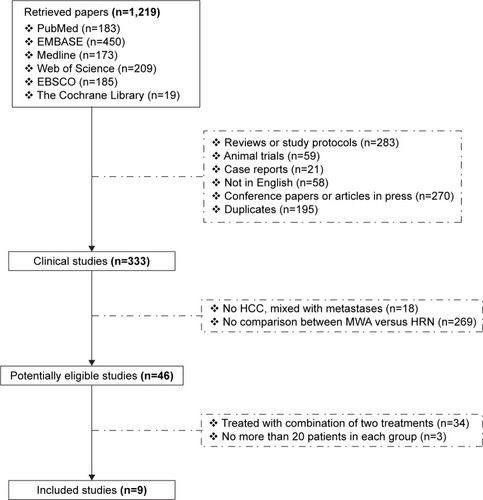
Table 1 Characteristics of studies included in the meta-analysis
Figure 2 Forest plot of meta-analysis comparing the OS between MWA and HRN (pooled with HR).
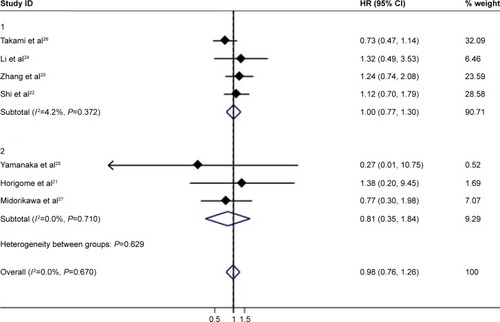
Figure 3 Funnel plot for assessing publication bias in OS.
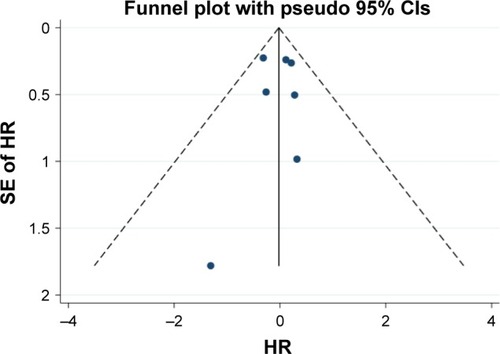
Figure 4 (A) Forest plot of meta-analysis comparing the OS between MWA and HRN (pooled with HR). Comparison of patients with HCC <3 cm. (B) Forest plot of meta-analysis comparing the OS between MWA and HRN (pooled with HR). Comparison of PMCT with HRN.
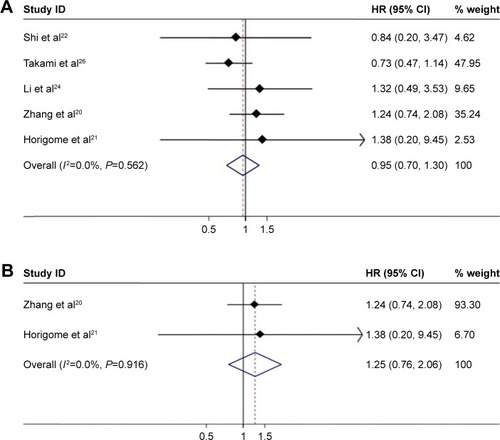
Figure 5 Forest plot of meta-analysis comparing the OS between MWA and HRN (pooled with OR).
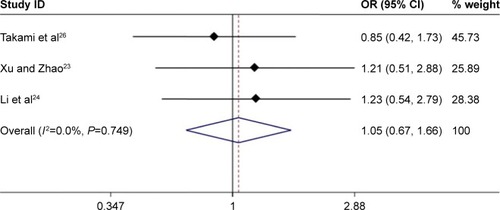
Figure 6 Forest plot of meta-analysis comparing the DFS between MWA and HRN (pooled with HR).
Abbreviations: DFS, disease-free survival; MWA, microwave ablation; HRN, hepatic resection.
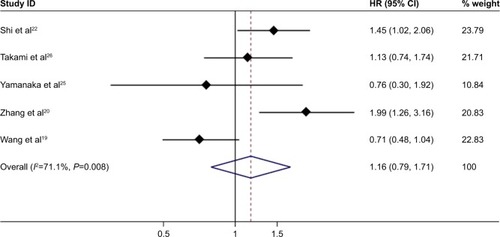
Figure 7 Funnel plot for assessing publication bias in DFS.
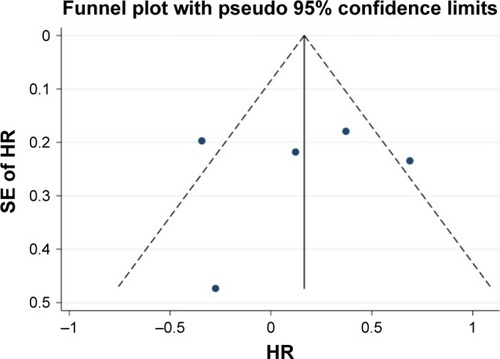
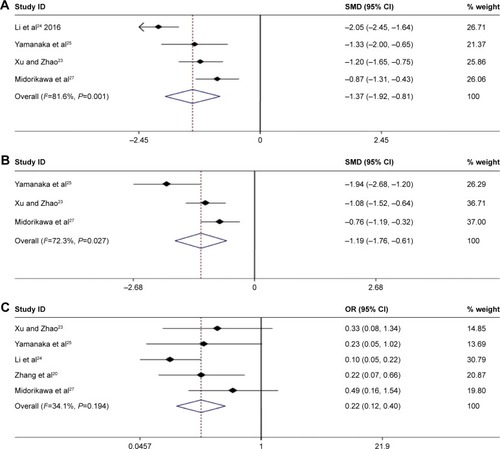
Figure 8 (A) Forest plot of meta-analysis comparing the DFS between MWA and HRN (pooled with HR). Comparing the patients with HCC smaller than 3 cm. Weights are from random effects analysis. (B) Forest plot of meta-analysis comparing the DFS between MWA and HRN (pooled with HR). Comparing PMCT with HRN.
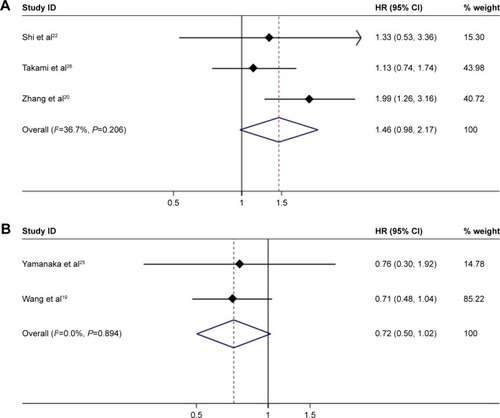
Figure 9 Forest plot of meta-analysis comparing the tumor recurrence between MWA and HRN (pooled with OR).
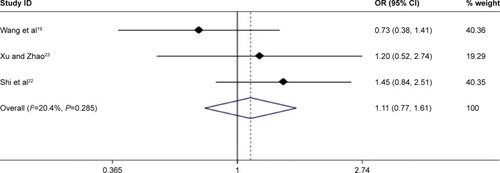
Figure 10 (A) Forest plot of meta-analysis comparing operation time between MWA and HRN. (B) Forest plot of meta-analysis comparing blood loss between MWA and HRN. (C) Forest plot of meta-analysis comparing complication between MWA and HRN. Weights are from random effects analyses.