
Figures & data
Table 1 Patient demographics and baseline characteristics by prior therapies use
Table 2 Prior SSA exposure by study treatment (full analysis set)
Figure 1 Progression-free survival by central review (full analysis set).
Abbreviations: CI, confidence interval; HR, hazard ratio; SSA, somatostatin analogs.
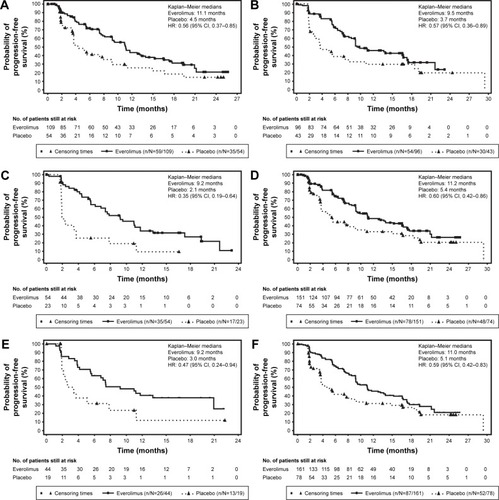
Table 3 Progression-free survival by central review (full analysis set)
Table 4 Progression-free survival and best overall response (central review) of everolimus in different lines of treatment
Figure 2 Percentage change from baseline in size of target lesion, central review (full analysis set).
Abbreviations: PD, progressive disease; SSA, somatostatin analogs.
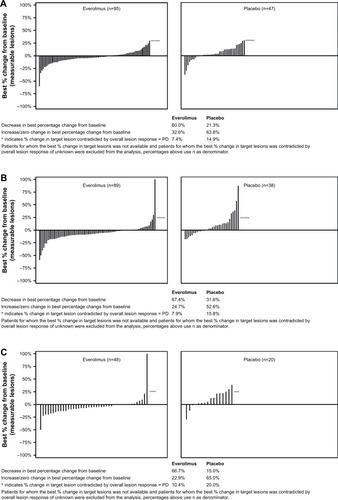
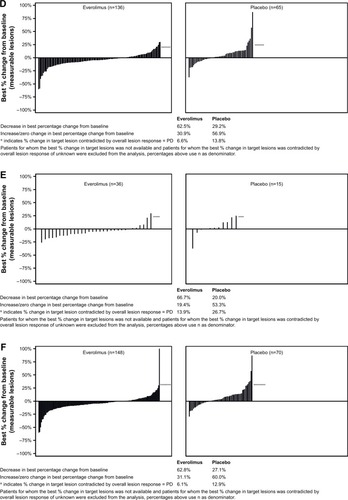
Table 5 Best overall response by central review
Table 6 Drug-related adverse events reported by ≥10% of the patients
Table 7 Drug-related adverse events reported by ≥10% of the patients with respect to prior PRRT
Table S1 List of independent ethics committees (IECs) or institutional review boards (IRBs) by study center