Figures & data
Figure 1 DEPDC1 expression levels in lung cancer cell lines. DEPDC1 is expressed in all the lung cancer cell lines tested, and expression levels in H3255 and A549 cells are higher than in the remaining cell lines.
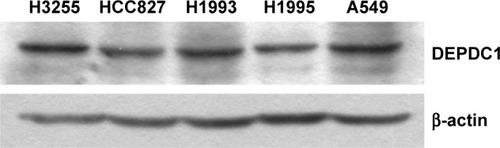
Figure 2 Overexpression of miR-130a inhibits proliferation of A549 cells and induces apoptosis. A549 cells were transfected with miR-130a-expressing or control plasmids and examined 72 h after transfection. (A) Compared with the control group, cells with miR-130a appeared thinner and longer. Scale bar 100 μm. (B) The amount of live cells was decreased to approximately 50% with miR-130a expression. (C) miR-130a transcript levels measured with qRT-PCR were increased approximately 50-fold. (D) Relative apoptosis of A549 cells determined with flow cytometry assay was increased approximately 30%. (E) DEPDC1 expression levels detected with Western blot were decreased dramatically. (F) A20 levels measured with qRT-PCR were increased twofold. **P<0.01; ***P<0.001.
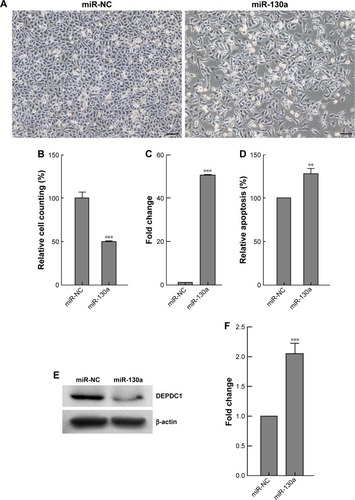
Figure 3 The 11R-DEP:611–628 peptide suppresses proliferation of A549 cells. Cells were treated with scramble peptide (A) or 11R-DEP:611–628 peptide (B) at the indicated concentration and time, and viability was determined with CCK-8 assay. Compared with scramble peptide, the 11R-DEP:611–628 peptide at 5 μM or higher concentration had a potent inhibitory effect on the proliferation of cells. *P<0.05.
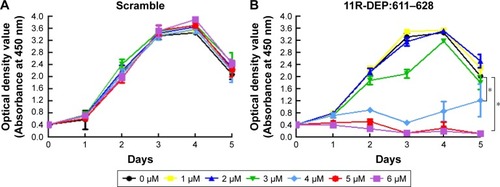
Figure 4 The 11R-DEP:611–628 peptide induces apoptosis of A549 cells. A549 cells were treated with 5 μM 11R-DEP:611–628 peptide or scramble peptide for the indicated time. (A) Cell morphological changes of A549 cells after peptide treatment were monitored with contrast phase microscope. The pictures showed that cells appeared abnormal and began to shrink within 1 h after treatment with the 11R-DEP:611–628 peptide, and the changes were time dependent. Scale bar 100 μm. (B, C) Compared with that of the scramble group, apoptosis levels of cells treated with the 11R-DEP:611–628 peptide were increased significantly. Representative data of flow cytometry are shown in panel B, and results of quantitative analysis of flow cytometry are shown in panel C. The difference between the 11R-DEP:611–628 and scramble groups was compared by paired t-test. Value of P=0.0006. (D) Western blot results showed that caspase 3 levels were decreased in cells treated with the 11R-DEP:611–628 peptide; meanwhile, cleaved caspase 3 levels were increased, indicating enhanced apoptosis.
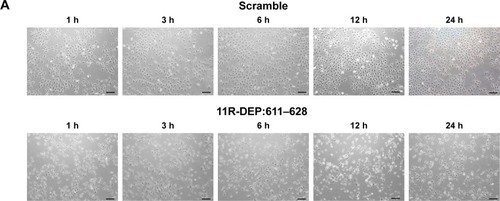
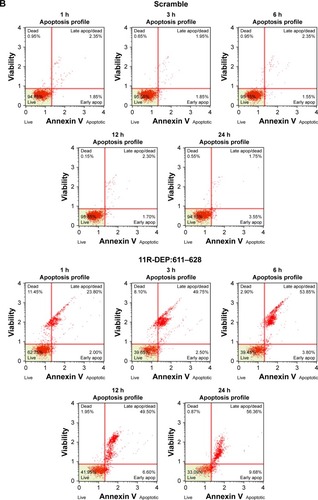
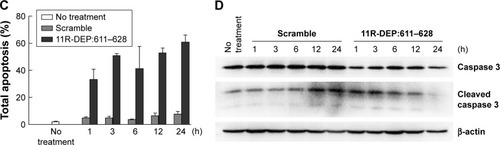
Figure 5 The 11R-DEP:611–628 peptide treatment results in activation of A20 expression and blocking of NF-κB (p65) nuclear translocation in A549 cells. (A) Cells were treated with 5 μM 11R-DEP:611–628 peptide for the indicated time, and the expression of A20 was increased approximately 2.5-fold, as shown by qRT-PCR results. P<0.05. (B, C) Cells were treated with 5 μM 11R-DEP:611–628 peptide or scramble peptide for 3 h. Results showed that the amount of NF-κB in the nuclei was significantly decreased 3 h after the 11R-DEP:611–628 peptide treatment. Representative images of immunofluorescence staining are shown in panel B: NF-κB (green) and nuclei (blue). Scale bar 20 μm. Quantitative results of immunofluorescence images are shown in panel C. ***P<0.001.
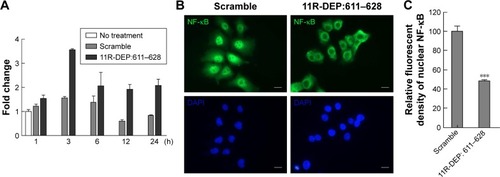
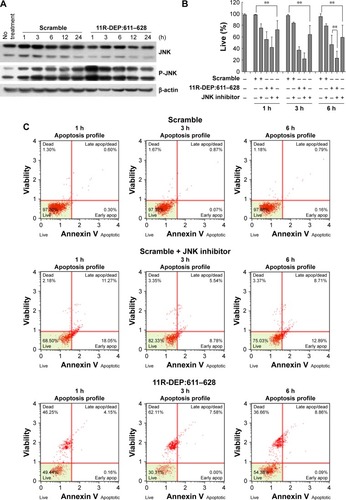
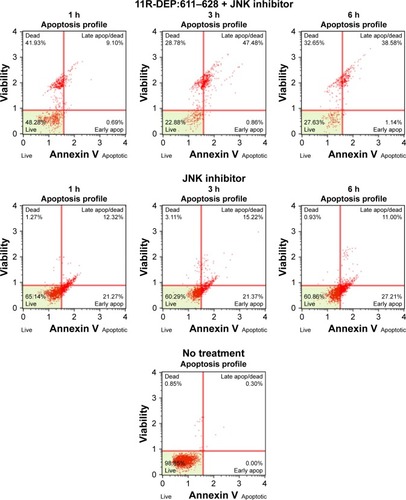
Figure 6 JNK inhibitor enhances apoptosis induced by the 11R-DEP:611–628 peptide in A549 cells. (A) Cells were treated with 11R-DEP:611–628 peptide for the indicated time, and p-JNK and total JNK levels were examined with Western blot. Data showed that the treatment led to increased p-JNK levels, indicating stronger JNK activity. (B, C) Cells were treated with the 11R-DEP:611–628 peptide in the presence or absence of JNK inhibitor (10 μM) for the indicated time, and apoptosis was examined with flow cytometry. The results showed that JNK inhibitor (SP600125) could induce apoptosis in A549 cells and enhance apoptosis induced by the 11R-DEP:611–628 peptide. Quantitative results of apoptotic A549 cells are shown in panel B, and the apoptosis profile of A549 cells is shown in panel C. **P<0.01.