
Figures & data
Figure 1 Structures of NVP-BEZ235 and compounds 1–3.
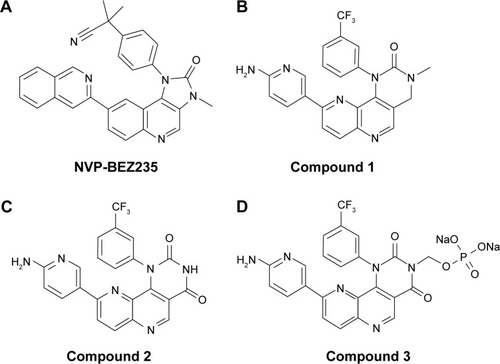
Figure 2 In vivo efficacy of compound 1 and NVP-BEZ235.
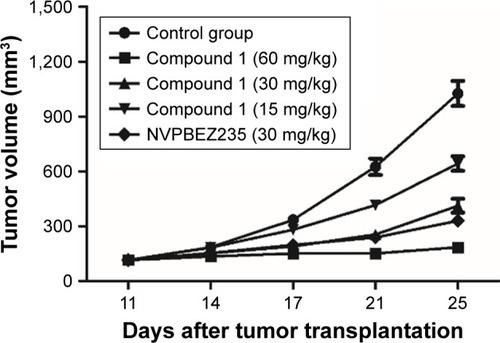
Figure 3 Plasma-concentration data of compounds 1 and 2 following a 60 mg/kg oral dose of compound 1 in BALB/c nude mice.
Abbreviations: LC, liquid chromatography; MS, mass spectrometry; AUC, area under the curve.
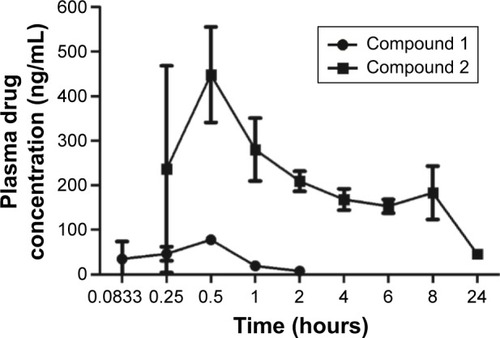
Figure 4 Drug concentrations of compound 1 and 2 in the liver microsomes at 60 minutes.
Abbreviations: LC, liquid chromatography; MS, mass spectrometry.
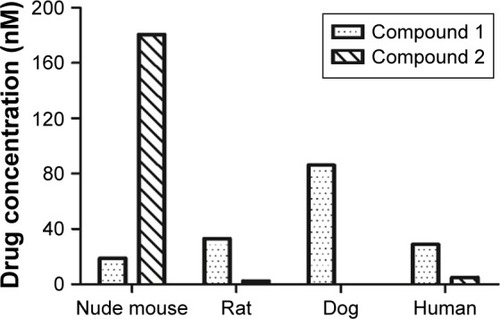
Table 1 PK/PD exploration in BALB/c nude-mouse xenograft model of PC3 cell line (n=8)
Table 7 Pharmacokinetics in rats of compound 2 after IV and PO dosing of compound 3
Figure 5 Synthetic route of compound 1.
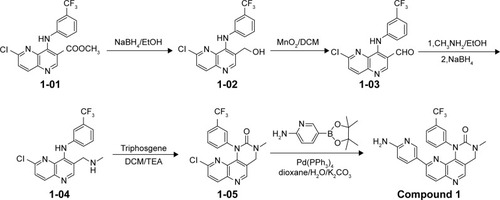
Figure 6 Synthetic route of compound 2.
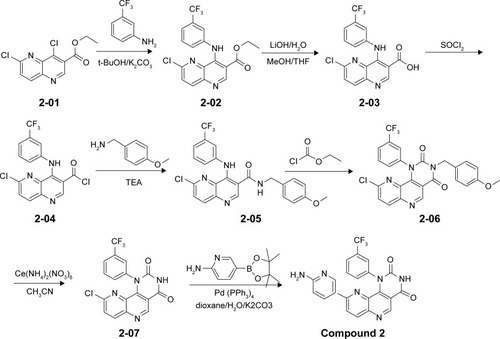
Figure 7 Synthetic route of compound 3.
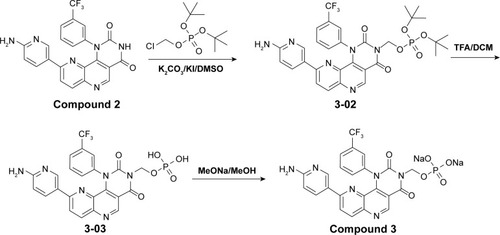
Table 2 Pharmacokinetic parameters of compound 1 and its metabolite compound 2 after oral dosing of compound 1 in nude mice (60 mg/kg)
Table 3 In vitro enzyme and cellular activity of compounds 1 and 2 and NVP-BEZ235 (IC50, nM)
Table 4 Liver-microsome stability of compound 1 in mouse, rat, dog, and human species at 1 μM
Table 5 Pharmacokinetics of compound 2 in rats with different preformulations
Table 6 Plasma concentration of compounds 3 and 2 at the same time points after dosing compound 3 in rats (intravenous injection, 2 mg/kg)