Figures & data
Figure 1 Representative IHC staining for the KIAA1522 protein in ESCC tumors and adjacent normal esophageal squamous epithelium.
Abbreviations: ESCC, esophageal squamous cell carcinoma; IHC, immunohisto-chemistry.
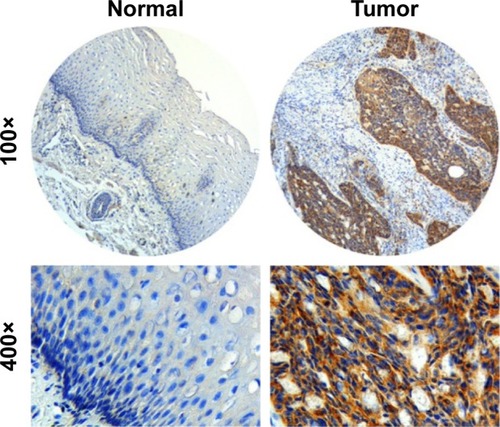
Table 1 Association of KIAA1522 levels with clinicopathological features of 342 patients with ESCC
Figure 2 Inhibition of KIAA1522 expression suppresses the proliferation and colony formation ability of ESCC cells.
Abbreviations: CCK-8, cell counting kit-8; Ctrl, control; ESCC, esophageal squamous cell carcinoma; GAPDH, glyceral dehyde 3-phosphate dehydrogenase; P, parental; SEM, standard error of the mean; si, siRNA; si-A, siKIAA-A; si-c, siKIAA-C.
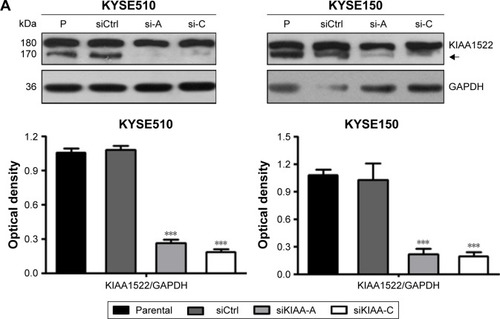
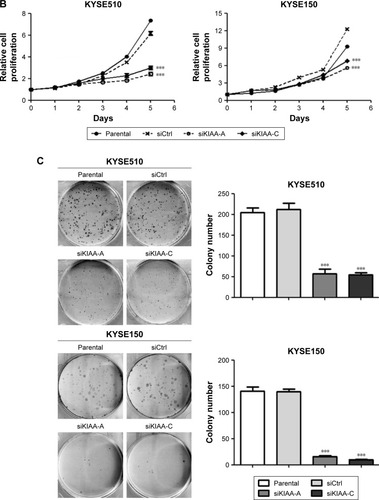
Figure 3 Knockdown of KIAA1522 expression reduces the tumorigenicity of esophageal carcinoma cells in nude mice.(p)(p)Notes: KYSE510 and KYSE150 cells were infected with lentiviruses expressing KIAA1522 shRNA (shKIAA) or negative control shRNA (shCtrl), and stable cell clones were selected with puromycin. (A) Western blot analysis of KIAA1522 expression levels in stable cell clones. The arrow indicates the position of KIAA1522 specific band. Relative ratios of absorbance for KIAA1522 to GAPDH were plotted. The data are presented as the mean ± SEM. ***P<0.001. (B) Colony formation assay. (C–E) KYSE150-shKIAA or shCtrl stable cell clones were implanted subcutaneously into nude mice (n=10 per group), the tumor volumes were measured every 3 days for 3 weeks, and sc tumors were excised 21 days after inoculation. (C) Tumor growth curves. The data are presented as the mean ± SEM. **P<0.01, ***P<0.001. (D) Tumor weight. ***P<0.001; (E) Photographs of sc tumors. Scale bar =1 cm.(p)(p)Abbreviations: Ctrl, control; GAPDH, glyceraldehyde 3-phosphate dehydrogenase; sc, subcutaneous; sh, shRNA.
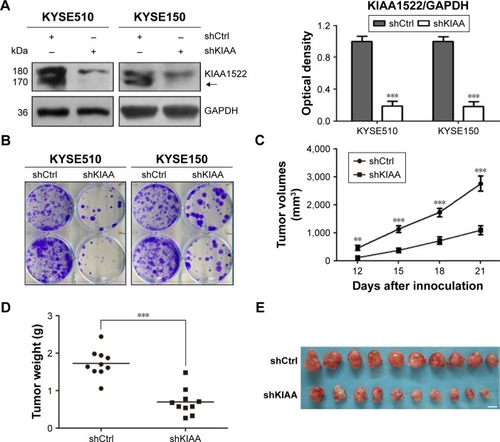
Figure 4 KIAA1522 depletion enhances anoikis in ESCC cells.
Abbreviations: Ctrl, control; ESCC, esophageal squamous cell carcinoma; FITC, fluorescein isothiocyanate; GAPDH, glyceraldehyde 3-phosphate dehydrogenase; NC, non-silencing; P, parental; PI, propidium iodide; polyHEMA, polyhydroxylethylmethacrylate; si, siRNA; si-A, siKIAA-A; si-B, siKIAA-B; si-c, siKIAA-C.
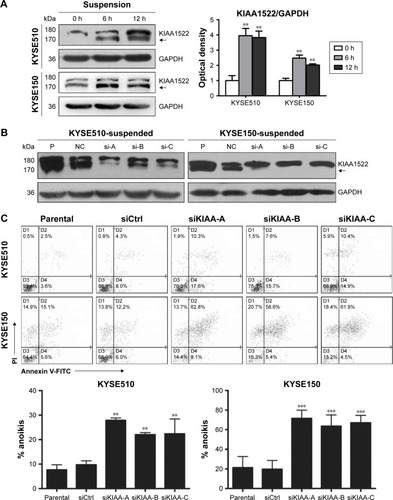
Figure 5 KIAA1522 promotes lung metastasis of KYSE150 cells in NOD/SCID mice.
Abbreviations: Ctrl, control; NOD/SCID, nonobese diabetic/severe combined immunodeficiency; polyHEMA, polyhydroxylethylmethacrylate; sh, shRNA.
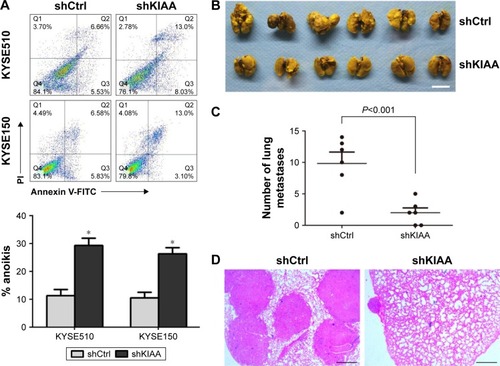
Figure 6 KIAA1522 activates ERK signaling pathway in ESCC cells.
Abbreviations: Ctrl, control; ERK, extracellular signal-regulated kinase; GAPDH, glyceraldehyde 3-phosphate dehydrogenase; NC, non-silencing; P, parental; pERK, phosphorylated ERK; polyHEMA, polyhydroxylethylmethacrylate; si, siRNA; si-A, siKIAA-A; si-c, siKIAA-C.
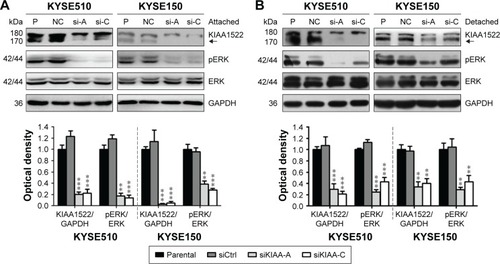
Figure S1 Kaplan–Meier overall survival curve according to the KIAA1522 levels in ESCC patients.
Notes: Overall survival is shown for the 115 patients with ESCC based on KIAA1522 levels as measured by immunohistochemistry. P-values were calculated by log-rank test.
Abbreviation: ESCC, esophageal squamous cell carcinoma.
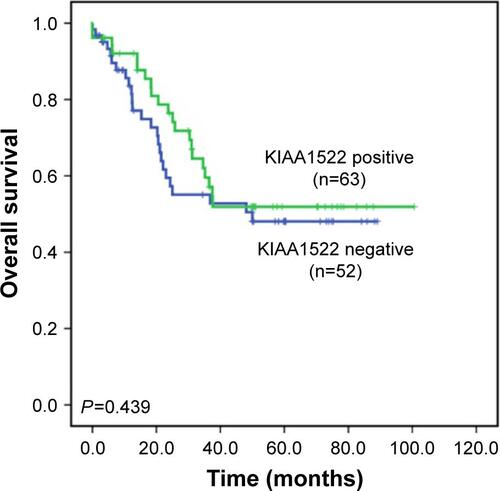
Figure S2 Effects of KIAA1522 knockdown on the apoptosis and cell cycle distribution of ESCC cells.
Notes: KYSE510 and KYSE150 cells were transiently transfected with KIAA1522-specific siRNA or control non-silencing siRNA. Cells were collected after 48 h and subjected to the analysis. The results of a flow cytometry analysis of apoptosis (A) and cell cycle distribution (B) are shown.
Abbreviations: Ctrl, control; ESCC, esophageal squamous cell carcinoma; si, siRNA.
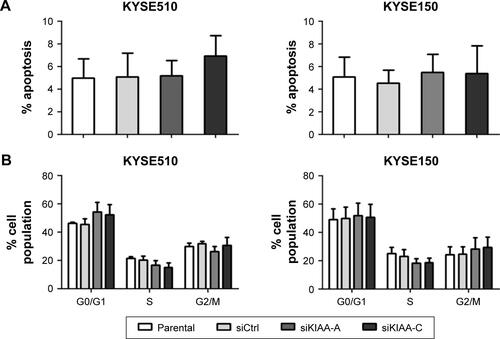
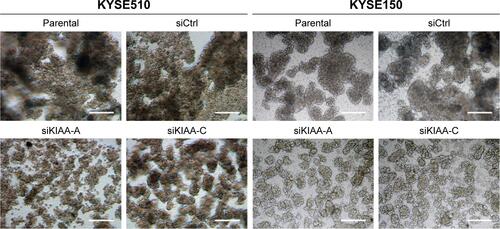
Figure S3 KIAA1522 depletion inhibits cell–cell adhesion.
Notes: KYSE150 and KYSE510 cells were transiently transfected with KIAA1522 siRNA or control non-silencing siRNA for 48 h and then seeded on polyHEMA-coated dishes. The cell morphology was observed under the phase. Scale bars =50 μm.
Abbreviations: Ctrl, control; polyHEMA, polyhydroxylethylmethacrylate; si, siRNA.