Figures & data
Figure 1 Flowchart of study selection.
Abbreviation: PDE5i, phosphodiesterase type 5 inhibitor.
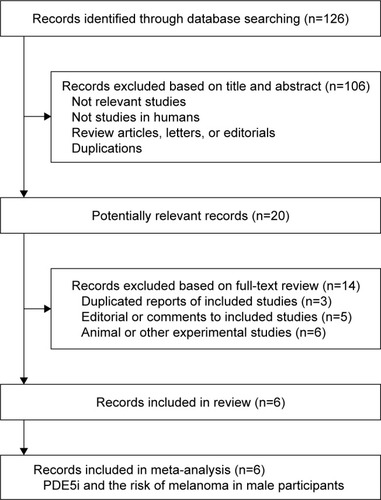
Table 1 Characteristics of the included studies
Figure 2 Forest plots for the meta-analysis of the association between PDE5i use and risk of melanoma presented as adjusted RR.
Notes: (A) Forest plots for all available observational studies; (B) forest plots stratified by study design (cohort studies or case–control studies). The effect size of each study is proportional to the statistical weight. The diamond indicates the overall summary estimate for the analysis; the width of the diamond represents the 95% CI.
Abbreviations: df, degrees of freedom; DNHR, Danish Nationwide Health Registries; IV, inverse variance; KPNC, Kaiser Permanente Northern California; PDE5i, phosphodiesterase type 5 inhibitor; RR, risk ratio; SE, standard error.
Abbreviations: df, degrees of freedom; DNHR, Danish Nationwide Health Registries; IV, inverse variance; KPNC, Kaiser Permanente Northern California; PDE5i, phosphodiesterase type 5 inhibitor; RR, risk ratio; SE, standard error.
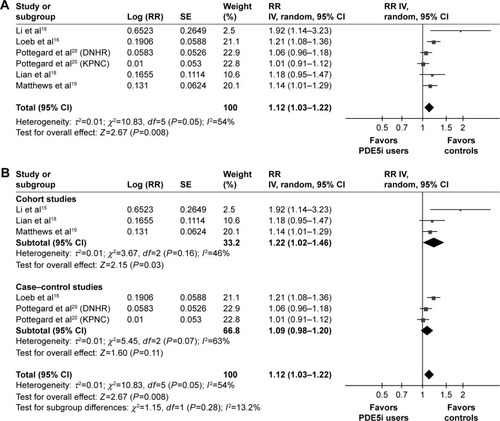
Figure 3 Forest plots for the meta-analysis of the association between PDE5i use and risk of melanoma presented as adjusted RR.
Notes: (A) Forest plots stratified by the timing of PDE5i administration (recent or early use of PDE5i); (B) forest plots stratified by the categories of PDE5i prescription (lowest or highest prescription category). The effect size of each study is proportional to the statistical weight. The diamond indicates the overall summary estimate for the analysis; the width of the diamond represents the 95% CI.
Abbreviations: df, degrees of freedom; DNHR, Danish Nationwide Health Registries; IV, inverse variance; KPNC, Kaiser Permanente Northern California; PDE5i, phosphodiesterase type 5 inhibitor; RR, risk ratio; SE, standard error.
Abbreviations: df, degrees of freedom; DNHR, Danish Nationwide Health Registries; IV, inverse variance; KPNC, Kaiser Permanente Northern California; PDE5i, phosphodiesterase type 5 inhibitor; RR, risk ratio; SE, standard error.
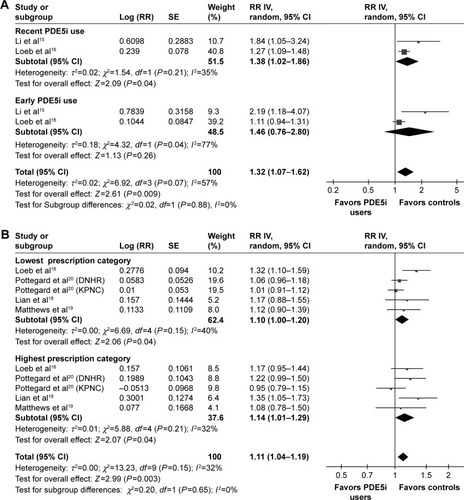
Figure 4 Forest plots for the meta-analysis of the association between PDE5i use and risk of melanoma presented as adjusted RR.
Notes: (A) Forest plots stratified by the individual PDE5i used (sildenafil, tadalafil, or vardenafil); (B) forest plots stratified by the stages of melanoma (in situ, localized, or nonlocalized melanoma). The diamond indicates the overall summary estimate for the analysis; the width of the diamond represents the 95% CI.
Abbreviations: df, degrees of freedom; DNHR, Danish Nationwide Health Registries; IV, inverse variance; KPNC, Kaiser Permanente Northern California; PDE5i, phosphodiesterase type 5 inhibitor; RR, risk ratio; SE, standard error.
Abbreviations: df, degrees of freedom; DNHR, Danish Nationwide Health Registries; IV, inverse variance; KPNC, Kaiser Permanente Northern California; PDE5i, phosphodiesterase type 5 inhibitor; RR, risk ratio; SE, standard error.
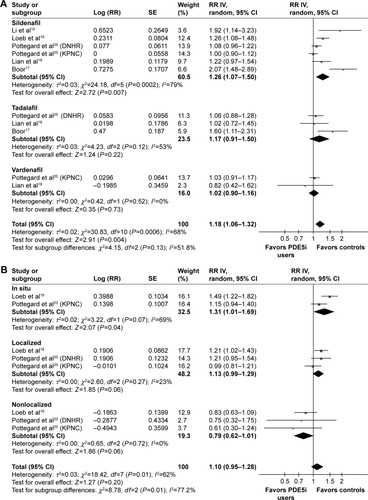
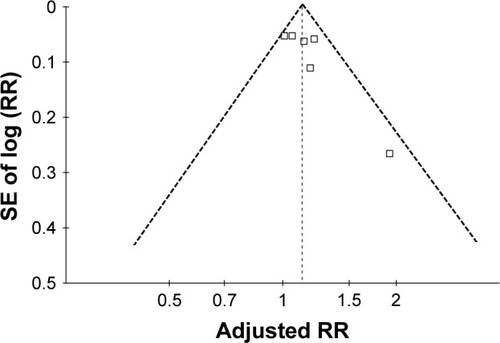
Figure 5 Funnel plot for the association between PDE5i use and risk of melanoma.
Notes: Each square indicates an included study. The x-axis represents the adjusted RR of the association between PDE5i use and risk of melanoma reported in each study, and the y-axis represents the SE of log (RR).
Abbreviations: PDE5i, phosphodiesterase type 5 inhibitor; RR, risk ratio; SE, standard error.
Abbreviations: PDE5i, phosphodiesterase type 5 inhibitor; RR, risk ratio; SE, standard error.