
Figures & data
Figure 1 Flow diagram of patient recruitment.
Abbreviations: AIs, aromatase inhibitors; ER, estrogen receptor; TAM, tamoxifen.
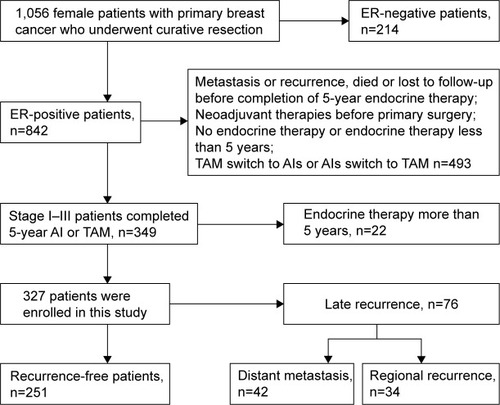
Figure 2 Immunohistochemical staining for Ki-67 expression in breast cancer.
Notes: (A) Ki-67 low expression (<14%), (B) Ki-67 high expression (≥14%). Original magnification ×200.
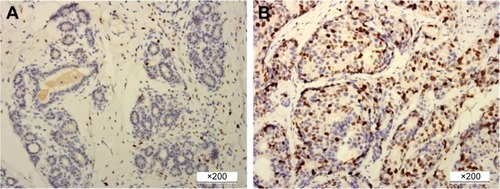
Table 1 Summary of patients’ clinicopathologic characteristics and the associations with RFS and DMFS for all patients
Figure 3 Kaplan–Meier plot of recurrence-free survival according to (A) histologic grade, P=0.000; (B) Ki-67, P=0.003 and (C) number of positive nodes, P=0.008.
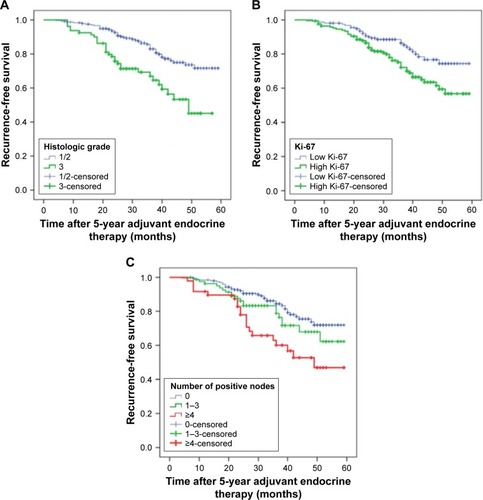
Figure 4 Kaplan–Meier plot of distant metastasis-free survival according to (A) histologic grade, P=0.000; (B) Ki-67, P=0.002 and (C) number of positive nodes, P=0.032.
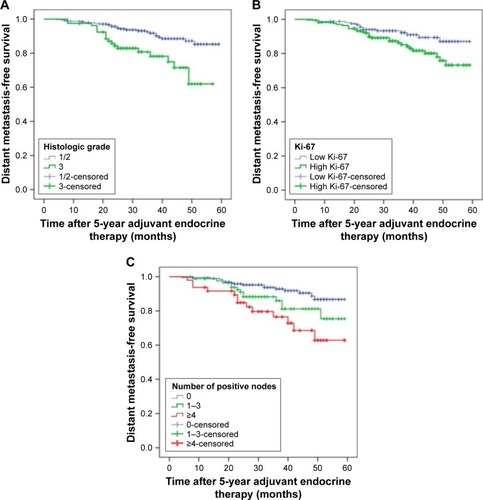
Table 2 Univariate analysis for RFS and DMFS in ER+ breast cancer
Table 3 Multivariable analyses of RFS and DMFS in ER+ breast cancer