
Figures & data
Figure 1 X-ray and CT images of the patient. (A) Preoperative X-ray of this patient showed that there was lytic destruction within the left proximal humerus, mixed with coarse trabeculation and sclerotic margin; (B) Cross section of the CT image showed cortical destruction without periosteal reaction; (C) CT image showed a lytic lesion with sclerotic margin (arrow); and (D) CT image showed coarse trabeculation within the lesion.
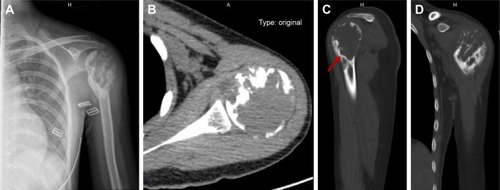
Figure 2 MRI images of this patient. (A) The lesion presented low signal on T1 sequence; (B) the lesion presented a relatively high signal than the adjacent muscle but a weaker signal than liquid on T2-sequencing images; (C) coronal section of the MRI image showed the lesion presented mixed signals on T2 sequence; and (D) a cross-section of the MRI image on T1 sequencing reveals a lesion with a slight enhancement.
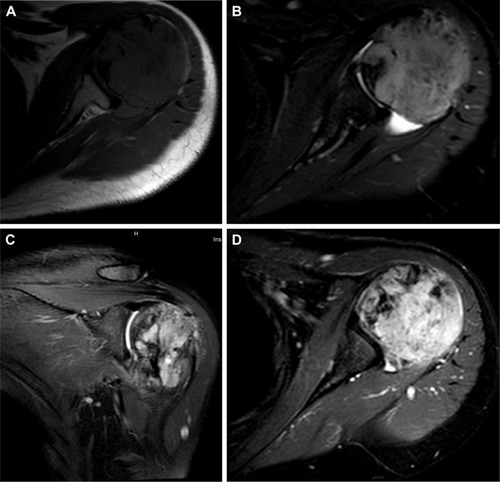
Figure 3 Bone scan showed the lesion had nuclear tracer uptake.
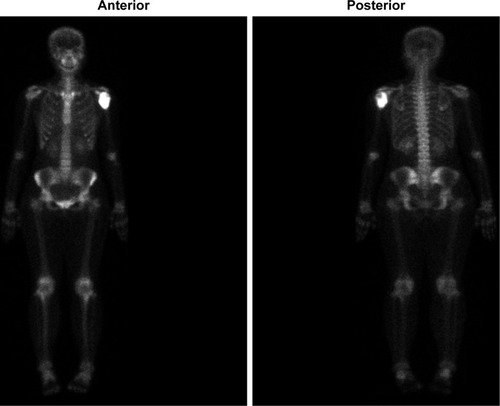
Figure 4 Postoperative images of this patient. (A and B) show the tumor specimen. The tumor arose within the medullary cavity of the proximal humerus and there is a sclerotic margin that separates the tumor from the normal medullary structures (red arrow); (C) Postoperative X-ray showed the location of the prosthesis was good, without dislocation.

Figure 5 Pathological images of the tumor. (A) Hyperchromatic fibroblast-like cells with mild nuclear atypia and occasional mitotic activity on H&E staining (×200, scale bar 50 μm); focal osteoid production (red arrow) was present within the moderately cellular fibroblastic stroma; (B) shows strong positive staining for SMA on immumohistochemical staining (×200, scale bar 50 μm); (C) shows strong CDK4 positivity of the tumor on immumohistochemical staining (×200, scale bar 50 μm); (D) shows focal weak MDM2 positive on immumohistochemical staining (×200, scale bar 50 μm).
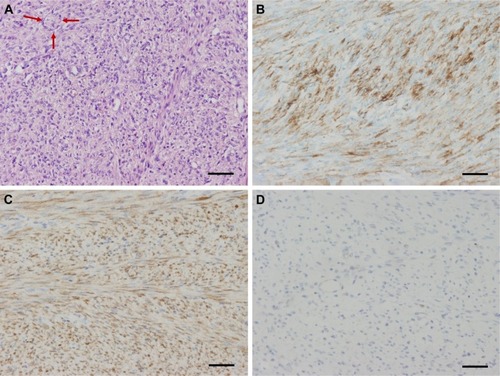
Table 1 Previous cases of LGCOS located at the proximal humerus