Figures & data
Figure 1 Flow diagram of the selection process.
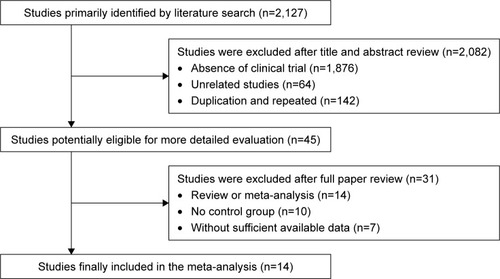
Table 1 Clinical information from the eligible trials in the meta-analysis
Table 2 Information of DC–CIK immunotherapy
Figure 2 Risk of bias summary: review of authors’ judgments about each risk of bias item for included studies.
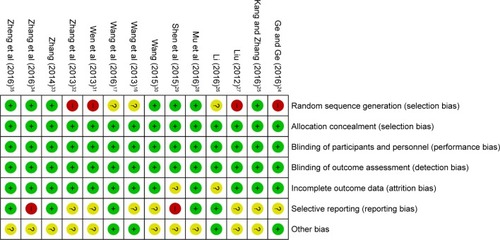
Figure 3 Forest plots of the comparison of ORR (A) and DCR (B) between the experimental and control groups.
Abbreviations: CI, confidence interval; DC–CIK, dendritic cells–cytokine-induced killer; DCR, disease control rate; M–H, Mantel–Haenszel; ORR, overall response rate.
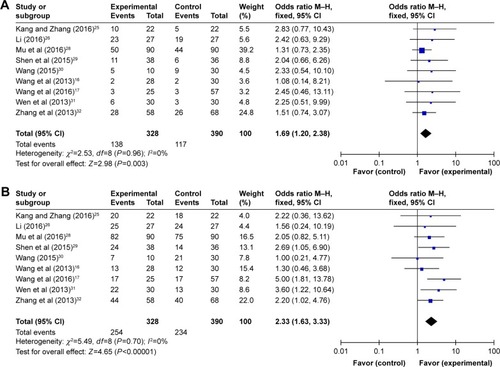
Table 3 Comparison of CR, PR, SD, PD, ORR, and DCR between the experimental and control groups
Figure 4 Forest plot of the comparison of OS between the experimental and control groups.
Abbreviations: CI, confidence interval; DC–CIK, dendritic cells–cytokine-induced killer; M–H, Mantel–Haenszel; OS, overall survival.
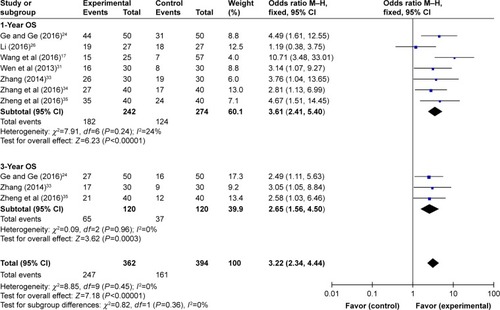
Figure 5 Forest plots of the comparison of QoL between the experimental and control groups.
Abbreviations: CI, confidence interval; DC–CIK, dendritic cells–cytokine-induced killer; Kps, Karnofsky Performance Score; M–H, Mantel–Haenszel; QoL, quality of life.
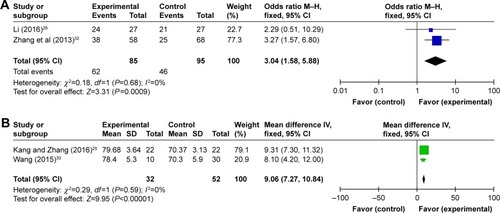
Figure 6 Forest plot of the comparison of immunophenotype in pre- and posttherapies.
Abbreviations: CI, confidence interval; IV, inverse variance.
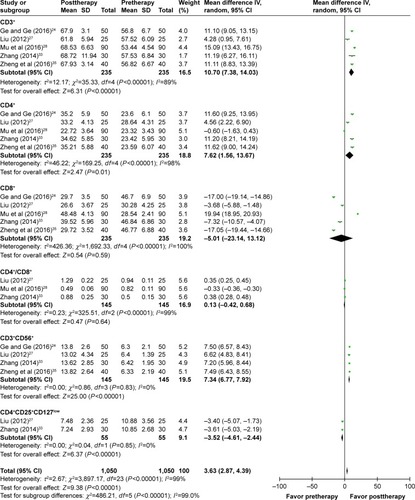
Figure 7 Forest plot of the comparison of IFN-γ and IL-4 in pre- and posttherapies.
Abbreviations: CI, confidence interval; IV, inverse variance; IFN-γ, interferon-γ; IL-4, interleukin-4.
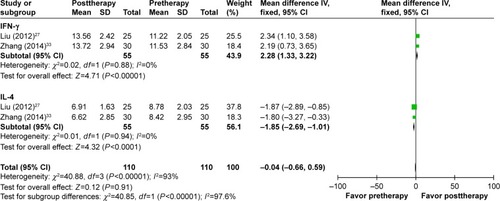
Table 4 Comparison of adverse events between the experimental and control groups
Table 5 Meta-analysis of 1-year OS, ORR, and DCR in CIK and DC–CIK subgroups
Figure 8 Funnel plot of each meta-analysis.
Abbreviations: DCR, disease control rate; ORR, overall response rate; OS, overall survival; SE, standard error; OR, odds ratio.
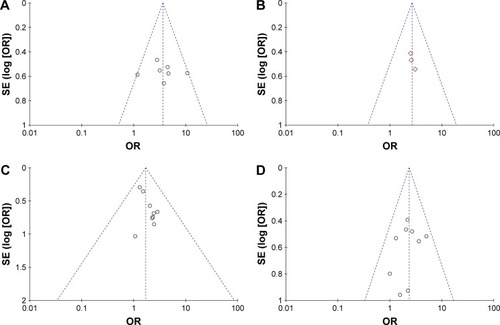
Figure S1 Forest plots of the comparison of PR (A), PD (B), CR (C), and SD (D) rates between the experimental and control groups.
Notes: Control group, chemotherapy alone group; experimental group, chemotherapy with DC–CIK immunotherapy. The fixed-effects meta-analysis model (M–H method) was used.
Abbreviations: CI, confidence interval; CR, complete response; CIK, cytokine-induced killer; DC–CIK, dendritic cells–CIK; M–H, Mantel–Haenszel; PD, progressive disease; PR, partial response; SD, stable disease.
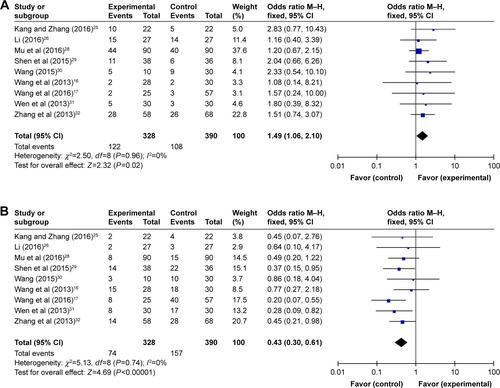
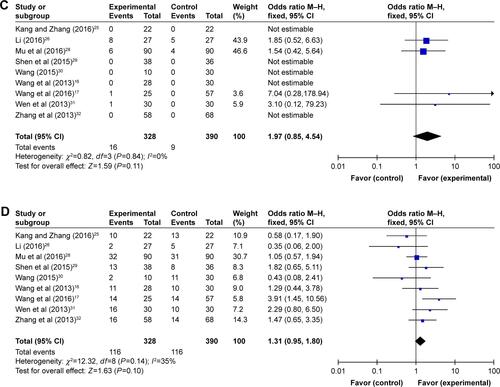
Figure S2 Forest plot of the comparison of adverse effects between the experimental and control groups.
Notes: Control group, chemotherapy alone group; experimental group, chemotherapy with DC–CIK immunotherapy. The random effects meta-analysis model (M–H method) was used.
Abbreviations: CI, confidence interval; DC–CIK, dendritic cells–cytokine-induced killer; M–H, Mantel–Haenszel.
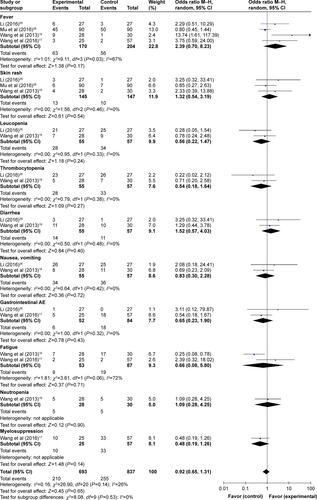
Figure S3 Forest plots of the comparison of all-grade adverse effects including fever (A), skin rash (B), leukopenia (C), thrombocytopenia (D), diarrhea (E), and nausea and vomiting (F).
Notes: Control group, chemotherapy alone group; experimental group, chemotherapy with DC–CIK immunotherapy. The fixed-effects meta-analysis model (M–H method) was used.
Abbreviations: CI, confidence interval; DC–CIK, dendritic cells–cytokine-induced killer; M–H, Mantel–Haenszel.
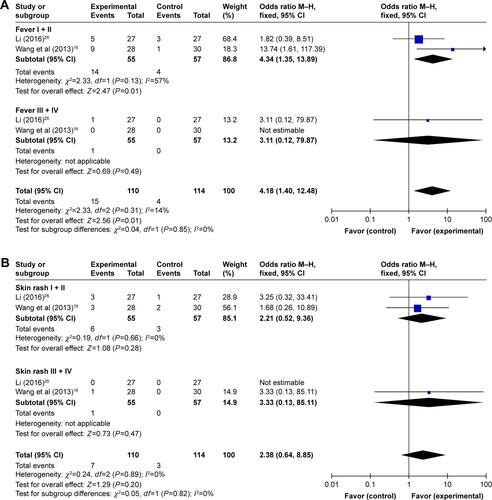
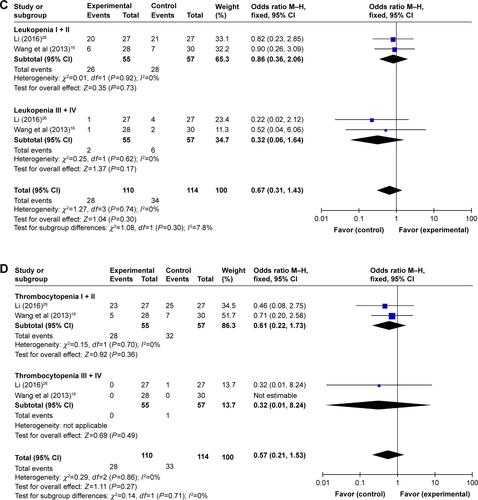
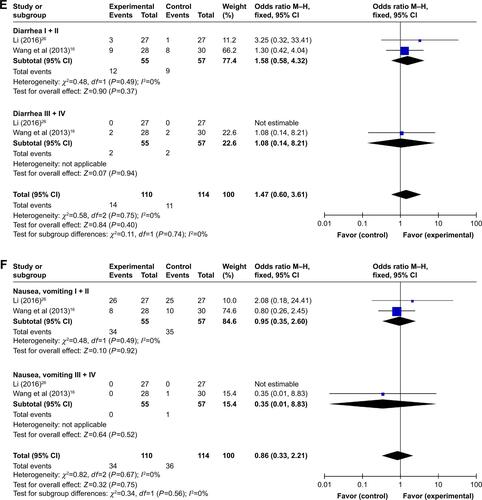
Figure S4 Forest plots of the comparison of ORR (A) and DCR (B) in CIK and DC–CIK subgroups.
Notes: Control group, chemotherapy alone group; experimental group, chemotherapy with DC–CIK immunotherapy. The fixed-effects meta-analysis model (M–H method) was used.
Abbreviations: CI, confidence interval; CIK, cytokine-induced killer; DC–CIK, dendritic cells–CIK; DCR, disease control rate; M–H, Mantel–Haenszel; ORR, overall response rate.
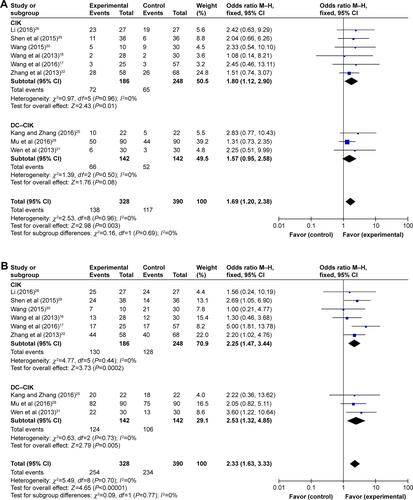
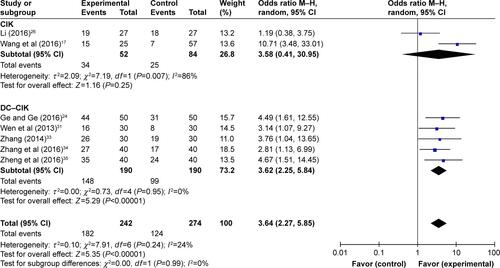
Figure S5 Forest plot of the comparison of 1-year OS in CIK and DC–CIK subgroups.
Notes: Control group, chemotherapy alone group; experimental group, chemotherapy with DC–CIK immunotherapy. The random effects meta-analysis model (M–H method) was used.
Abbreviations: CI, confidence interval; CIK, cytokine-induced killer; DC–CIK, dendritic cells–CIK; M–H, Mantel–Haenszel; OS, overall survival.