
Figures & data
Figure 1 DNA methylation of PAX1 and SOX1 analyzed in CRC using TCGA dataset.
Abbreviations: CRC, colorectal cancer; PAX1, paired boxed gene 1; SOX1, sex-determining region Y-related high-mobility group box 1; TCGA, The Cancer Genome Atlas.
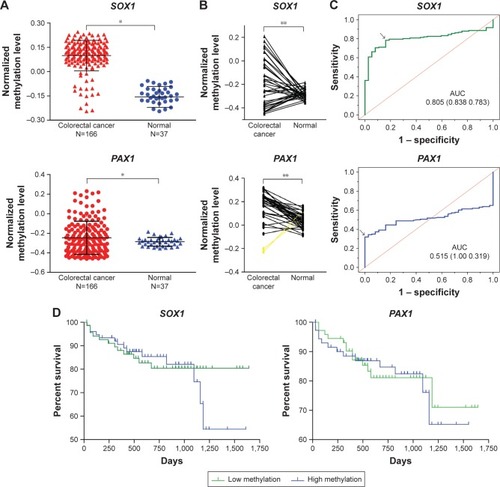
Figure 2 DNA methylation status of PAX1 and SOX1 genes in CRC tissues and paired normal tissues from 41 patients with CRC.
Abbreviations: AUC, areas under the curve; CRC, colorectal cancer; PAX1, paired boxed gene 1; ROC, receiver-operating characteristic; SOX1, sex-determining region Y-related high-mobility group box 1.
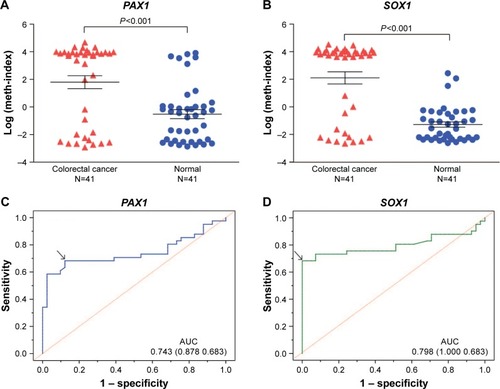
Table 1 Association of the frequency of methylation occurrence of PAX1 and SOX1 in cancer tissues to the clinical characteristics of 41 patients with CRC
Table 2 Sensitivities, specificities, and AUC of PAX1 and SOX1 methylation in detecting CRC tumor (n=41)
Table 4 Correlation between methylation levels of PAX1 and SOX1 in the cancer tissues and clinical characteristics of 41 patients with CRC
Table 3 Sensitivities, specificities, and AUC of PAX1 and SOX1 methylation in detecting low (n=27) and high (n=14) TNM stages
Figure 3 Methylation distribution of CRC tissues at various TNM stages.
Abbreviations: AUC, areas under the curve; CRC, colorectal cancer; PAX1, paired boxed gene 1; ROC, receiver-operating characteristic; SOX1, sex-determining region Y-related high-mobility group box 1.
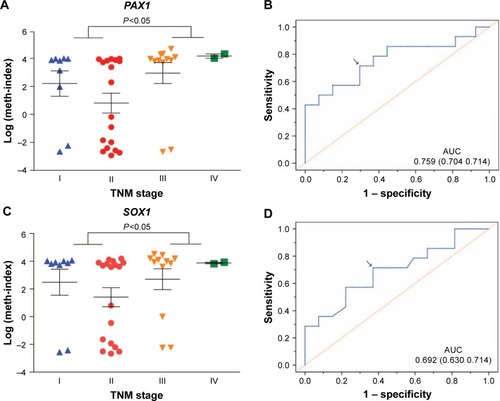
Figure 4 mRNA expression of SOX1/PAX1 genes in CRC tissues of 41 patients with CRC.
Abbreviations: CRC, colorectal cancer; PAX1, paired boxed gene 1; SOX1, sex-determining region Y-related high-mobility group box 1.
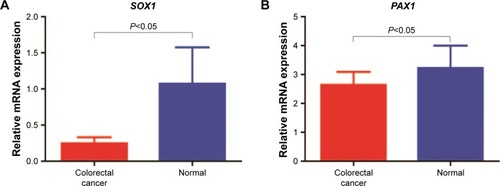
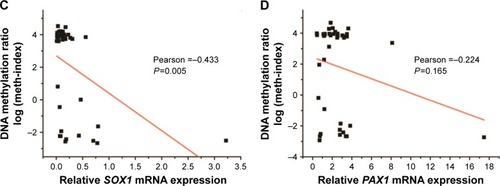
Figure 5 Representative expression of PAX1 and SOX1 protein in colorectal tissues compared with paired normal tissues.
Abbreviations: CRC, colorectal cancer; IHC, immunohistochemical; PAX1, paired boxed gene 1; SOX1, sex-determining region Y-related high-mobility group box 1.
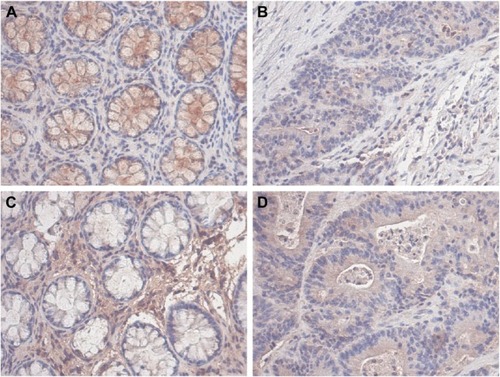
Figure S1 Correlation between the methylation status of SOX1 and PAX1 in the same CRC samples.
Notes: Pearson’s correlation was used to measure the linear relationship between methylation log (meth-index) of PAX1 (x-axis) and SOX1 (y-axis) in 41 CRC tissues (A) and 166 CRCs downloaded from TCGA dataset (B). P-values were performed by independent sample t-test.
Abbreviations: CRC, colorectal cancer; PAX1, paired boxed gene 1; SOX1, sex-determining region Y-related high-mobility group box 1; TCGA, The Cancer Genome Atlas.
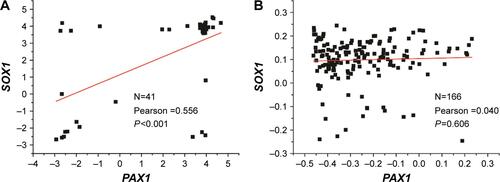
Table S1 Association of the frequency of methylation occurrence of cg20907471 (PAX1) and average of cg22303211 and cg06675478 (SOX1) in cancer tissues to the clinical characteristics of 166 patients with CRC using TCGA datasets (n=166)