Figures & data
Figure 1 Histology of the left supraclavicular lymph node biopsy, August 2014.
Notes: Adenocarcinoma (A, hematoxylin & eosin stain, magnification, ×200) harboring EGFR 19 exon deletion (B, ARMS). Strong expression of ALK protein with the monoclonal ALK antibody (C, clone D5F3, IHC, magnification, ×200). Head MRI (D) and isotope bone scans (E) revealed metastatic mass lesions in the brain and bones. The first and third panels in E show images captured from the front, and the second and fourth panels show images captured from back. The first and second images were taken at a different time than the third and fourth images. CT scans of the thorax prior to and following treatment with gefitinib: (F) prior to treatment, (G) 7 months, and (H) 8 months after treatment with gefitinib. The red arrows indicate the tumor lesions. Rn is the ratio of the fluorescence emission intensity of target reporter genes to that of the standard dyes. ∆Rn=Rn–baseline. All image scans were captured in the Affiliated Cancer Hospital of Xiangya School of Medicine.
Abbreviations: ARMS, amplication-refractory mutation system assay; CT, computed tomography; EGFR, epidermal growth factor receptor; IHC, immunohistochemistry; MRI, magnetic resonance imaging; Rn, normalized reporter.
Abbreviations: ARMS, amplication-refractory mutation system assay; CT, computed tomography; EGFR, epidermal growth factor receptor; IHC, immunohistochemistry; MRI, magnetic resonance imaging; Rn, normalized reporter.
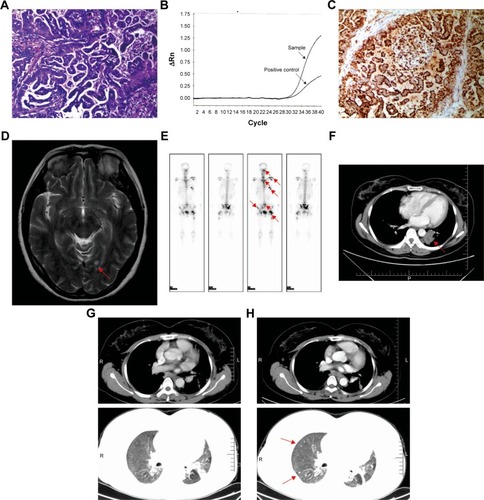
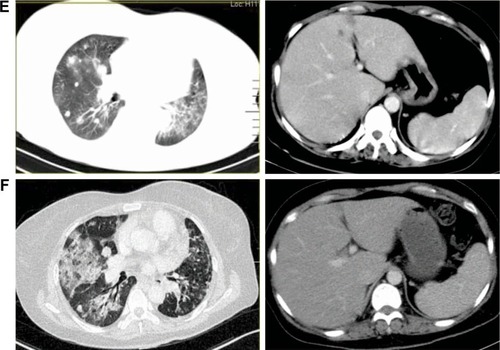
Figure 2 CT scans of the thorax prior to and following treatment with gefitinib and crizotinib.
Notes: (A) Prior to crizotinib treatment. (B) 10 months after treatment with gefitinib and crizotinib. NGS results of metastatic lymph node biopsy in R4, April 2016 (red arrows indicate the tumor lesions): (C) deletion in EGFR exon 19 (p.747_750del); (D) mTOR mutation.
Abbreviations: CT, computed tomography; EGFR, epidermal growth factor receptor; mTOR, mammalian target of rapamycin; NGS, next-generation sequencing.
Abbreviations: CT, computed tomography; EGFR, epidermal growth factor receptor; mTOR, mammalian target of rapamycin; NGS, next-generation sequencing.
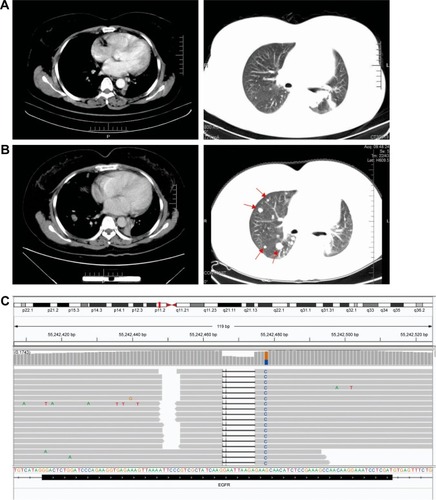
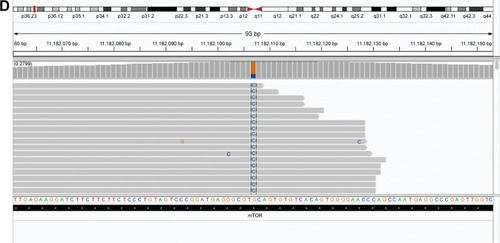
Figure 3 Histology of the metastatic lymph node biopsy in R4, April 2016.
Notes: (A) ALK-negative result on IHC (D5F3, magnification, ×100). (B) ALK-negative result in FISH. A cutoff of >15% tumor cells harboring split signals was used to determine ALK-positive tumors. The results of the left supraclavicular lymph node biopsy, August 2014: (C) deletion in EGFR exon 19 (p.747_750del) as seen in NGS; FISH reveals a split of red and green probes; (D) ALK showed no signal in FISH.
Abbreviations: EGFR, epidermal growth factor receptor; FISH, fluorescence in situ hybridization; IHC, immunohistochemistry; NGS, next-generation sequencing.
Abbreviations: EGFR, epidermal growth factor receptor; FISH, fluorescence in situ hybridization; IHC, immunohistochemistry; NGS, next-generation sequencing.
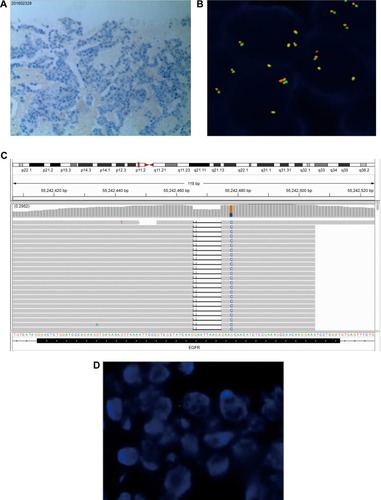
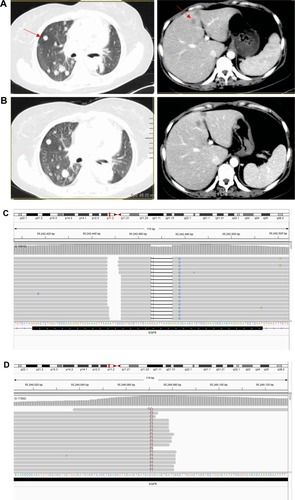
Figure 4 CT scans of the thorax prior to and following treatment with chemotherapy, everolimus and AZD9291 and NGS results of plasma ctDNA.
Notes: (A) After 2 cycles of chemotherapy treatment and prior to everolimus, the tumor progressed to the liver and contralateral lung (B) 1.5 months after everolimus treatment and prior to AZD9291 (red arrows indicate the tumor lesions). (C) Deletion in EGFR exon 19 (p.747_750del); (D) T790M in EGFR exon 20. (E) 1.4 months, and (F) 1.9 months after treatment with AZD9291.
Abbreviations: CT, computed tomography; ctDNA, circulating tumor DNA; EGFR, epidermal growth factor receptor; NGS, next-generation sequencing.
Abbreviations: CT, computed tomography; ctDNA, circulating tumor DNA; EGFR, epidermal growth factor receptor; NGS, next-generation sequencing.