Figures & data
Figure 1 Acquisition process of eligible studies in the meta-analysis.
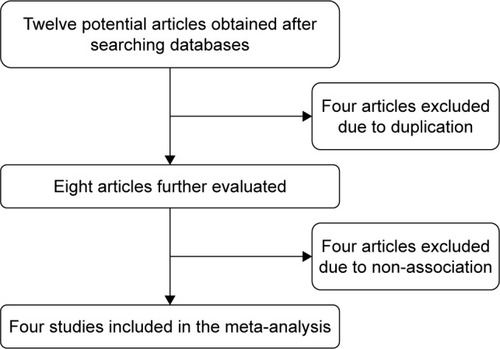
Table 1 Quality evaluation of the eligible articles
Table 2 The main characteristics of the eligible studies
Table 3 The genotype frequencies of EFEMP1 rs1346787, rs3791679, and rs1346786 polymorphisms
Table 4 Meta-analysis of the associations between EFEMP1 SNPs and glioma risk
Table 5 The association of EFEMP1 rs3791679 with glioma risk after omitting Jiang et al’s studyCitation13
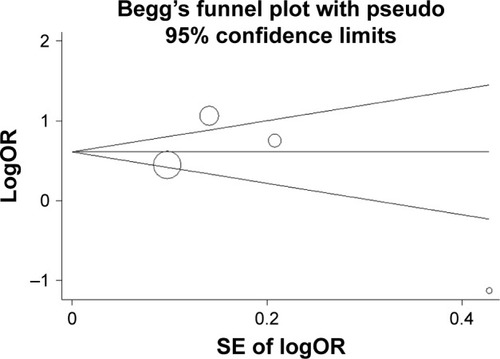
Figure 2 Begg’s funnel plot assessing the publication bias for rs3791679 polymorphism under AG vs GG model.
Abbreviations: OR, odds ratio; SE, standard error.