Figures & data
Figure 1 Expression of Syt-7 mRNA in hepatoma cell lines. Fluorescence images and expression of Syt-7 mRNA in SMMC-7721 cells transfected with LVpGCSIL-004PSC39360. (A) Syt-7 mRNA was highly expressed in Huh-7 and Hep3B cells; moderately expressed in SMMC-7721, HepG2, and BEL-7402 cells; and lowly expressed in L-O2 cell. (B) Fluorescence images of cells before and after transfection. Magnification ×100. (C) Expression of Syt-7 mRNA in SMMC-7721 cells transfected with LVpGCSIL-004PSC39360. The expression levels of Syt-7 mRNA in SMMC-7721 cells in the shSyt-7 group were significantly lower (P=0.000) than that of control cells. The overall knockout efficiency was 62.3%, **P<0.01. (D) the expression levels of Syt-7 protein in shSyt-7 group cells were significantly lower than that of shCtrl group.
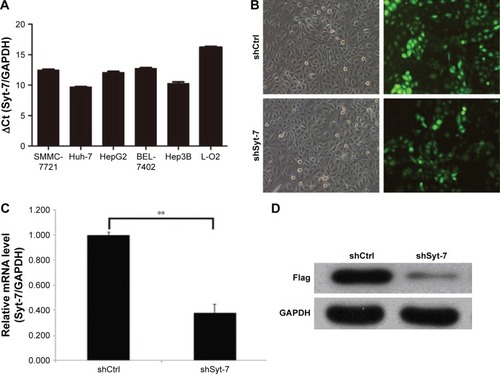
Table 1 ΔCt of Huh-7, Hep3B, SMMC-7721, HepG2, and BEL-7402 cells
Figure 2 The changes of cell growth in SMMC-7721 cells transfected with LVpGCSIL-004PSC39360. Cell growth was measured via multiparametric high-content screening every day for 5 days. Data are shown as mean ± standard deviation. (A) Fluorescence images of cells for every day. Magnification ×100. (B) Growth curve of cells (Day 4: 3.35±0.16 vs 2.17±0.19, P=0.001; Day 5: 4.54±0.15 vs 2.79±0.15, P=0.000).
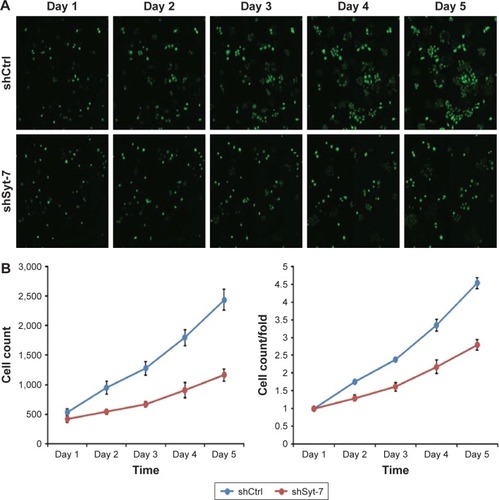
Table 2 Cell numbers and growth rate
Figure 3 The changes of cell proliferation in SMMC-7721 cells transfected with LVpGCSIL-004PSC39360, which were measured by MTT. The proliferation of cells were significantly inhibited in shSyt-7 group cells (Day 4: 3.40±0.29 vs 2.05±0.03, P=0.000; Day 5: 5.02±0.04 vs 2.90±0.02, P=0.000).
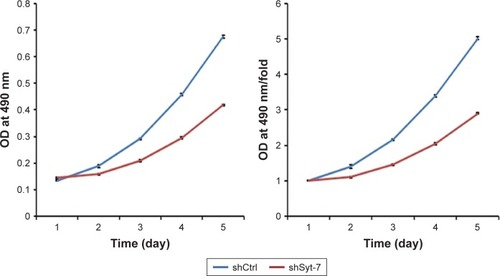
Figure 4 Syt-7 knockdown significantly reduced colony formation in SMMC-7721 cells, as assessed by colony formation assay. **P<0.01.
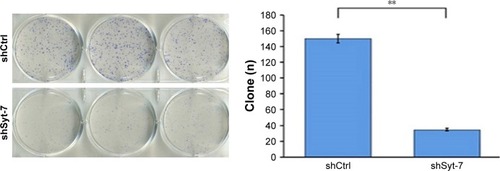
Figure 5 The changes in the cell cycles of cell in SMMC-7721 cells transfected with LVpGCSIL-004PSC39360, the proportion of cells in the S phase significantly increased (21.29±1.14 vs 16.59±0.03, P=0.0004). *P<0.05; **P<0.01.
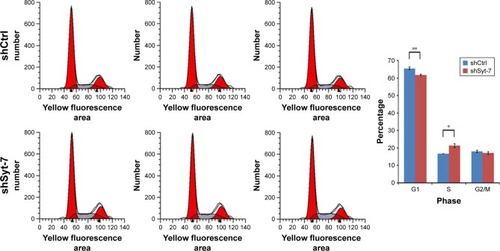
Figure 6 The effect of Syt-7 knockdown on tumor progression in vivo. (A) Fluorescence images of mice models. (B) The levels of fluorescent expression in shSyt-7 group were significantly decreased than that in control group (2.83×1,010±4.29×10⁹ vs 5.55×1,010±9.07×10⁹, P<0.05). (C) The subcutaneous xenograft mice models and representative images of tumors in mice in models. (D) Changes in the tumor volume (2.61±7.71 vs 823.55±401.62, P<0.05). (E) Changes in the tumor weight (0.005±0.011 vs 0.830±0.396, P<0.05).
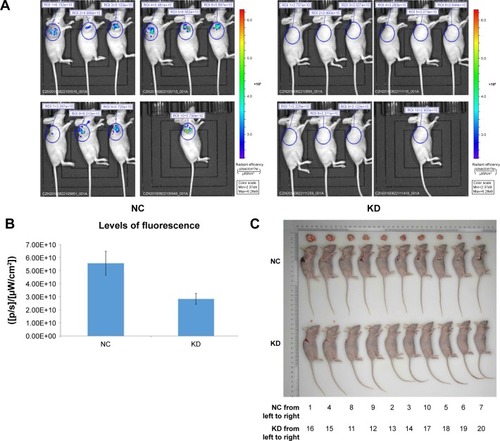
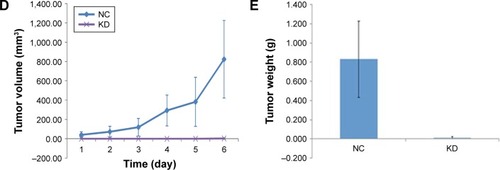
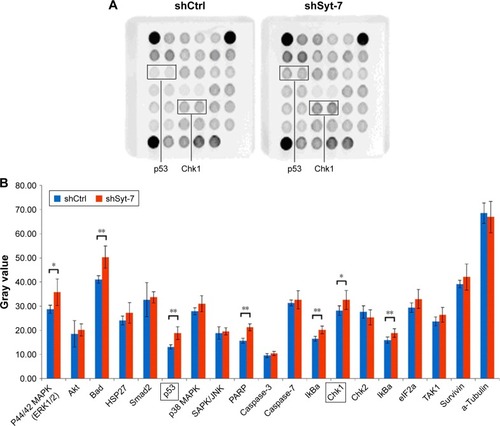
Figure 7 Mechanism study of Syt-7 knockdown in hepatoma cells. (A) Intracellular signaling array after LVpGCSIL-004PSC39360 transfection; (B) Syt-7 knockdown significantly increased the phosphorylation of Chk1 and p53. *P<0.05; **P<0.01.