
Figures & data
Figure 1 Kaplan–Meier curve for OS of CCC according to gene alteration.
Notes: (A) OS by EGFR mutation. (B) OS by EGFR T790M mutation and negative EGFR mutation. (C) OS by EGFR T790M mutation and other positive EGFR mutation. (D) OS by PIK3CA mutation. (E) OS by KRAS mutation.
Abbreviations: CCC, cholangiocarcinoma; HR, hazard ratio; mOS, median OS; OS, overall survival.
Abbreviations: CCC, cholangiocarcinoma; HR, hazard ratio; mOS, median OS; OS, overall survival.
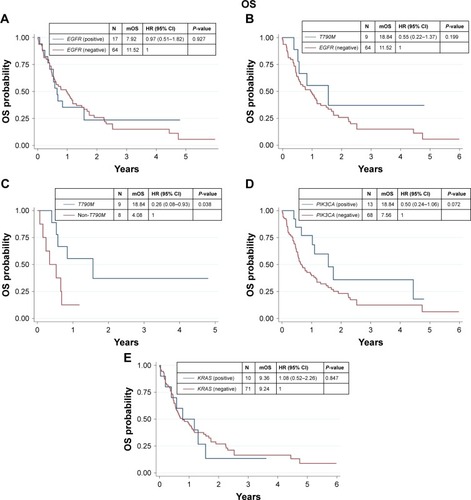
Figure 2 Kaplan–Meier curve for PFS of CCC according to gene alteration.
Notes: (A) PFS by EGFR mutation. (B) PFS by EGFR T790M mutation and negative EGFR mutation. (C) PFS by EGFR T790M mutation and other positive EGFR mutation. (D) PFS by PIK3CA mutation. (E) PFS by KRAS mutation.
Abbreviations: CCC, cholangiocarcinoma; HR, hazard ratio; mPFS, median PFS; PFS, progressive-free survival.
Abbreviations: CCC, cholangiocarcinoma; HR, hazard ratio; mPFS, median PFS; PFS, progressive-free survival.
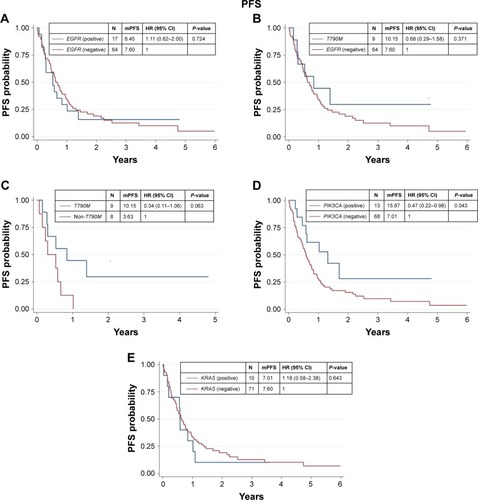
Table 1 Molecular alteration in CCC
Table 2 OS and PFS of CCC by molecular analysis (N=81)
Figure 3 Analysis of EGFR T790M mutation using RT-PCR, ddPCR, and Sanger sequencing.
Notes: (A) Amplification curve of sample with EGFR c2369 C>T (T790M) mutation (blue line) and internal control (red line). (B) ddPCR amplitude scatter plot, single-well data for wild-type DNA; mutation assay (FAM, channel 1), wild-type assay (Hex, channel 2). (C) Chromatograms EGFR c2369 C>T (T790M).
Abbreviations: Ch1, channel 1; Ch2, channel 2; ddPCR, droplet digital polymerase chain reaction; FAM, 6-carboxyfluorescein; Hex, hexachloro-6-carboxyfluorescein; neg, negative; pos, positive; RT-PCR, real-time polymerase chain reaction.
Abbreviations: Ch1, channel 1; Ch2, channel 2; ddPCR, droplet digital polymerase chain reaction; FAM, 6-carboxyfluorescein; Hex, hexachloro-6-carboxyfluorescein; neg, negative; pos, positive; RT-PCR, real-time polymerase chain reaction.
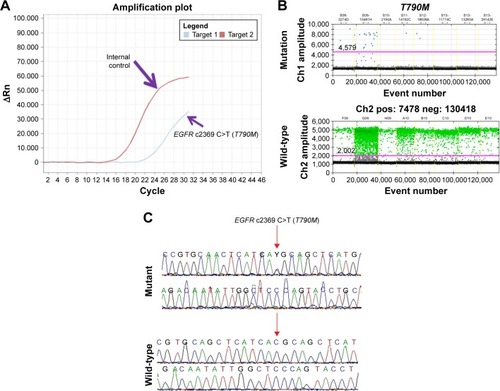
Table 3 Detection of EGFR mutation by qRT-PCR, Sanger sequencing, and ddPCR
Table 4 Demographic and clinical characteristics of patients categorized by mutations
Table 5 Median Ki-67 in each group of molecular analysis and tumor marker
Table S1 List of mutation and cosmic ID identities of EGFR, PIK3CA, KRAS, and BRAF for ARMS-qPCR Amoy Kit
Table S2 List of primers for direct sequencing EGFR (Ref seq: NG_007726.3)