Figures & data
Figure 1 Experimental design for comparative transcriptome analysis.
Notes: HA and U251 cells were treated with 2 Gy dose of radiation. The RNAs were prepared 1 hour after treatment. Next-generation sequencing was used to generate transcriptome profiles. DEG1 and DEG2 represent the differentially expressed mRNAs and lncRNAs in radiation-treated HA and U251 cells compared with their control counterparts. DEG3 refers to transcriptome differences between HA and U251 cells without any treatment. DEG4 represents transcriptome differences between radiation-treated HA and radiation-treated U251 cells.
Abbreviations: HA, human astrocyte; DEG, differentially expressed gene.
Abbreviations: HA, human astrocyte; DEG, differentially expressed gene.
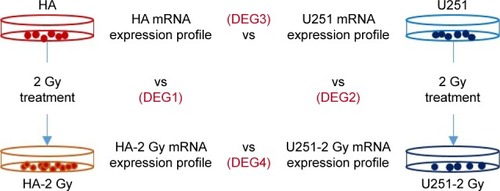
Figure 2 Differentially expressed mRNAs between radiation-treated and nontreated HA (A) and U251 (B) cells. (C) Genes regulated by radiation in both HA and U251 cells. Genes oppositely regulated by radiation are highlighted.
Abbreviations: HA, human astrocyte; DEG, differentially expressed gene.
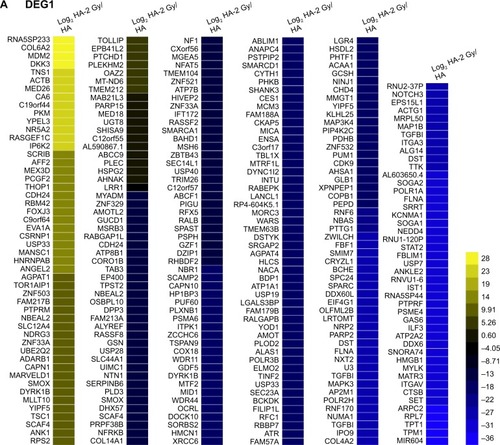
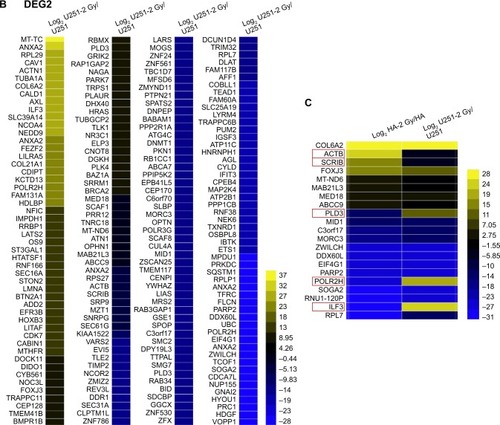
Figure 3 GO analysis of DEGs between radiation-treated and nontreated HA and U251 cells.
Notes: Differentially expressed mRNAs between radiation-treated and nontreated HA (A) and U251 (B) cells were subjected to ipathwayGuide online software for GO analysis. Top 10 GO terms in cellular components (red), molecular function (yellow) and the biological process (blue) category are listed.
Abbreviations: GO, gene ontology; DEG, differentially expressed gene; HA, human astrocyte.
Abbreviations: GO, gene ontology; DEG, differentially expressed gene; HA, human astrocyte.
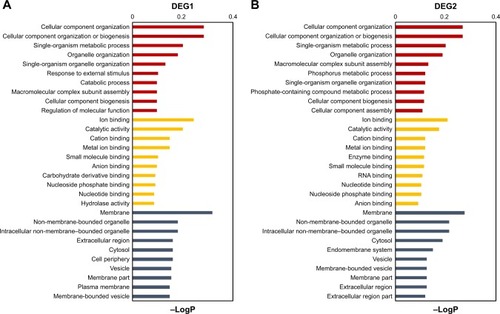
Figure 4 Pathway analysis of DEGs between radiation-treated and nontreated HA and U251 cells.
Notes: Differentially expressed mRNAs between radiation-treated and nontreated HA (A) and U251 (B) cells were subjected to ipathwayGuide online software for pathway analysis. Top 20 impact signaling terms are listed. Red boxes indicate the role of this pathway in differential responses between normal astrocytes and glioma cells was further identified by cell-based assay.
Abbreviations: DEG, differentially expressed gene; HA, human astrocyte; ECM, extracellular matrix.
Abbreviations: DEG, differentially expressed gene; HA, human astrocyte; ECM, extracellular matrix.
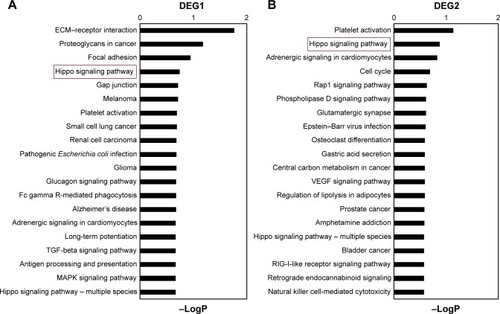
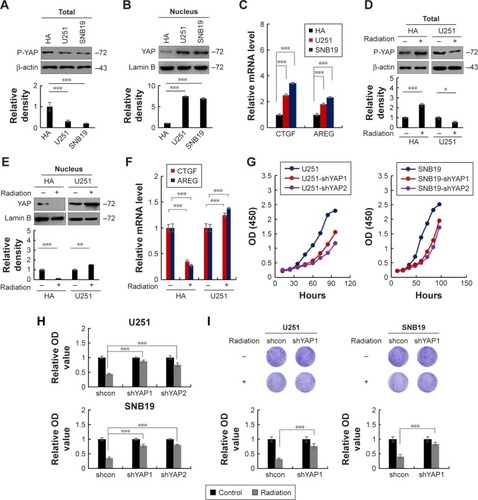
Figure 5 Suppression of Hippo/YAP signaling pathway induces radiation resistance in glioma cells.
Notes: (A) The level of phosphorylated YAP is lower in U251 and SNB19 cells than in HA cells. (B) The level of nuclear YAP is higher in U251 and SNB19 cells than in HA cells. (C) The mRNA levels of YAP target genes (CTGF, AREG) are higher in U251 and SNB19 cells than in HA cells. ***P<0.001. (D) Radiation (2 Gy) increased the levels of phosphorylated YAP in HA cells and decreased it in U251 cells. (E) Radiation (2 Gy) reduced the levels of nuclear YAP in HA cells and increased it in U251 cells. (F) Radiation (2 Gy) reduced the mRNA levels of CTGF and AREG in HA cells and increased them in U251 cells. (G) YAP depletion reduced proliferation of U251 (left) and SNB19 (right) cells. (H and I) YAP depletion reduced the cytotoxic effect of radiation (10 Gy) on U251 and SNB19 cells as indicated by cell viability (H) and colony formation (I) assays. *P<0.05, **P<0.01 and ***P<0.001.
Abbreviations: HA, human astrocyte; OD, optical density; P-YAP, phosphorylated YAP; shcon, sh-control.
Abbreviations: HA, human astrocyte; OD, optical density; P-YAP, phosphorylated YAP; shcon, sh-control.