Figures & data
Figure 1 Flow chart for model selection process.
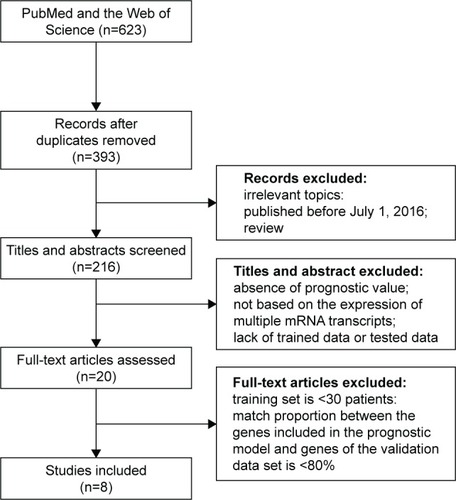
Table 1 Features of eight published models that prognosticate breast cancer outcomes
Table 2 Features of ten publicly available microarray data sets used to validate published risk scores
Table 3 Heterogeneity analyses for eight publicly available models
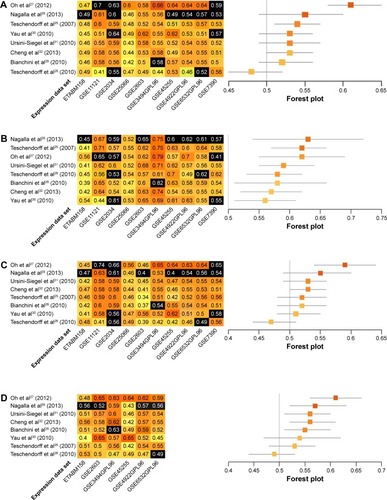
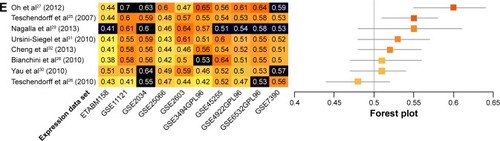
Figure 2 Performance assessment of published immune-related risk scores.
Notes: (A) C-indices are given for predictions of overall survival for each of eight models in each of ten microarray data sets (left panel). Data sets used as training data sets during model development are shown in black. Darker shades of orange corresponded to higher prediction levels; 0.5= random risk score, 1.0= perfect prediction. Models are ordered from the highest to the lowest summary C-index (top to bottom). Summary C-indices are given for each model with training data sets excluded (orange boxes; right panel); 95% CIs (gray lines) were obtained by resampling cases. C-indices are presented for predictions of overall survival in ER−, ER+, LN+, and LN− data sets (left panels of B–E, respectively). Summary C-indices in ER−, ER+, LN+, and LN− data sets are given for each model with training data sets excluded (orange boxes; right panels of B–E, respectively).
Abbreviations: C-indices, concordance indices; ER, estrogen receptor; LN, lymph node.
Abbreviations: C-indices, concordance indices; ER, estrogen receptor; LN, lymph node.