Figures & data
Figure 1 Effect of astemizole or gefitinib on the metabolic activity of lung cancer cells.
Notes: Astemizole or gefitinib decreased the proliferation of A549 (A and B) and NCI-H1975 (C and D) lung cancer cells in a concentration-dependent manner. Four different cell cultures were performed with six technical replicates each. Mean ± SD, *p<0.05 vs vehicle (V [DMSO]).
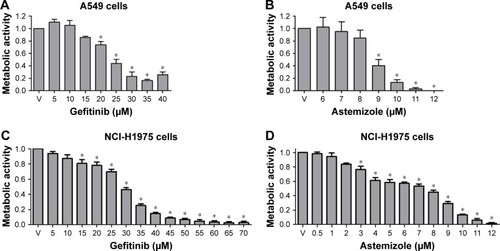
Table 1 Inhibitory concentrations (ICs) of astemizole or gefitinib in the proliferation of human lung cancer cells
Figure 2 Enhanced effect of the combination astemizole–gefitinib on the metabolic activity, survival and apoptosis of lung cancer cells.
Notes: The combinations of the drugs at different ICs had outstanding effects on metabolic activity (A) in comparison with the effects of the drugs alone at their corresponding concentrations. Some of the most superior effects were observed when combining astemizole and gefitinib at their IC20 (A-IC20 and G-IC20, respectively), and A-IC20 with G-IC50 in both cell lines. Four different cell cultures were performed with eight technical replicates each. Mean ± SD, ap<0.05 vs vehicle (DMSO), bp<0.05 vs A-IC20, cp<0.05 vs G-IC20, dp<0.05 vs A-IC50 and ep<0.05 vs G-IC50. Colony formation assays (B) showed that both drugs decreased cell survival, but the effect was significantly stronger with the drug combination in both cell lines. Representative images of A549 colonies are shown in the bottom of the panel. Three different cell cultures were performed with three technical replicates each. Mean ± SD, *p<0.05 vs medium and vehicle (DMSO), #p<0.05 vs A-IC20 and &p<0.05 vs G-IC20. Astemizole, gefitinib and the drug combination significantly increased apoptosis in comparison with controls in A549 cells (C), but the effect of the combination was not higher than that produced by astemizole alone. However, in NCI-H1975 cells, the drugs alone did not increase apoptosis in comparison with controls, but the drug combination was the only condition that clearly increased apoptosis in comparison with the rest of the groups. Representative plots from FACS experiments in A549 cells indicating the different quadrants separating the cell populations (bottom panels). Four different cell cultures were tested with three technical replicates each. Mean ± SD, *p<0.05 vs vehicle (DMSO), #p<0.05 vs A-IC20, &p<0.05 vs G-IC20.
Abbreviations: A, astemizole; G, gefitinib; FACS, fluorescence-activated cell sorting.
Abbreviations: A, astemizole; G, gefitinib; FACS, fluorescence-activated cell sorting.
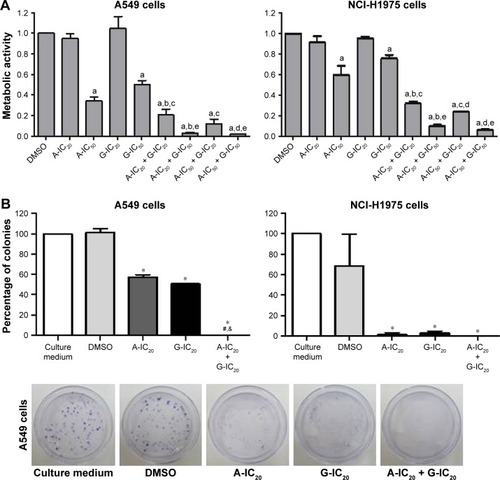
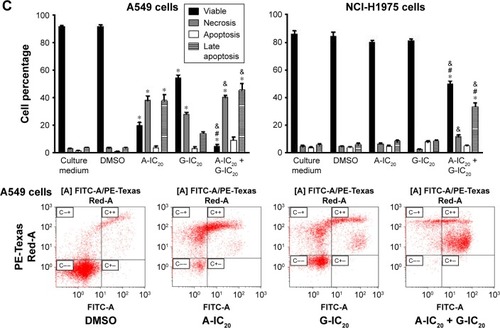
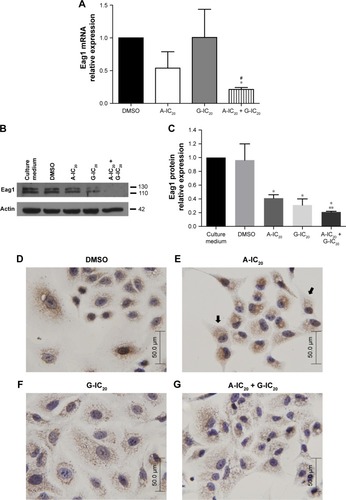
Figure 3 The combination astemizole–gefitinib downregulates Eag1 expression in A549 cells.
Notes: (A) Relative Eag1 mRNA expression was decreased only in the cells treated with the drug combination. Mean ± SD, *p<0.05 vs vehicle (DMSO), #p<0.05 vs G-IC20. Western blot analysis revealed that Eag1 protein expression is clearly downregulated by the drug treatment in a significant manner (B and C). Mean ± SD, *p<0.05 vs medium and vehicle (DMSO), **p<0.05 vs A-IC20. The presence of Eag1 protein is revealed by immunocytochemistry as brown immunostaining (D–G). Vehicle-treated and astemizole-treated cells show strong Eag1 expression in the cytoplasm (D and E, respectively), but astemizole induced subcellular localization changes in some areas adjacent to the nucleus. Gefitinib-treated cells (F) showed less immunostaining, but the weakest signal was observed in the cells treated with the drug combination (G). Three different cell cultures were performed for all the experiments. Original magnification =200×.
Abbreviations: A, astemizole; G, gefitinib.
Abbreviations: A, astemizole; G, gefitinib.