
Figures & data
Figure 1 Age composition of 1,990 GC patients.
Abbreviation: GC, gastric cancer.
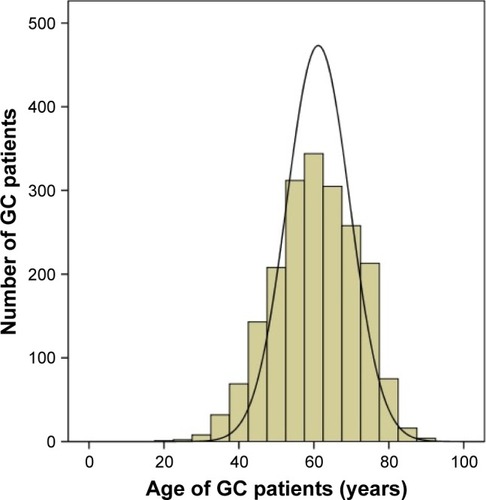
Table 1 Clinicopathological features of younger and older GC patients
Figure 2 Comparison of overall survival between younger and older gastric cancer patients.
Abbreviation: Cum, cumulative.
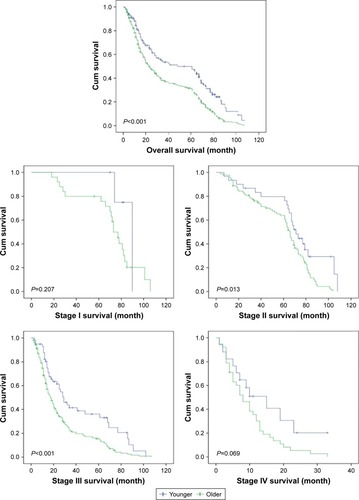
Table 2 Survival analysis of the 470 younger and older GC patients
Table 3 Survival analysis of the 112 younger GC patients
Table 4 Survival analysis of the 358 older GC patients
Figure 3 Survival analysis of MLR and PNI in younger and older gastric cancer patients.
Abbreviations: Cum, cumulative; MLR, monocyte-to-lymphocyte ratio; PNI, prognostic nutritional index.
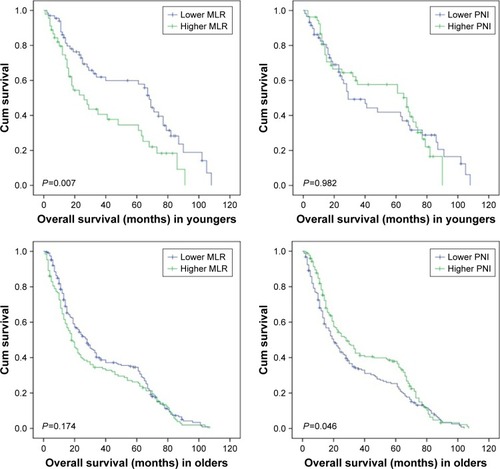
Table 5 Comparison of MLR, PNI, lymphocyte, monocyte and albumin between younger and older GC patients