Figures & data
Table 1 The clinical characteristics of patients according to low and high NANOG expression
Figure 1 Representative immunohistochemical staining sections for NANOG with different histologic scores (H-scores) (×200).
Abbreviations: ADC, adenocarcinoma; SQCC, squamous cell carcinoma.
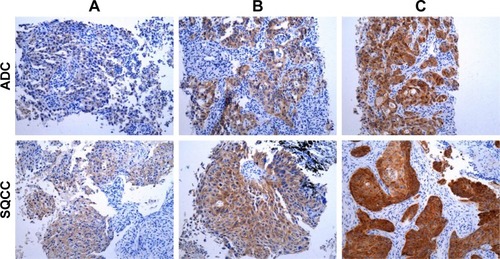
Figure 2 Distribution of H-scores.
Abbreviations: ADC, adenocarcinoma; SQCC, squamous cell carcinoma.
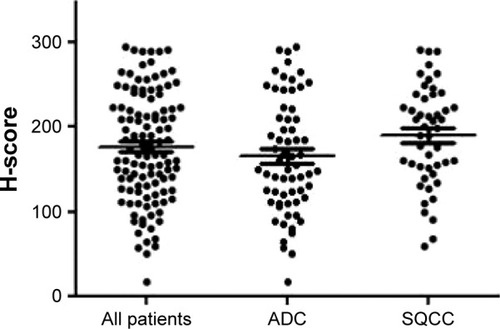
Figure 3 Kaplan–Meier survival curves for progression-free survival (A) and overall survival (B) in all patients. p-values were determined using the log-rank test.
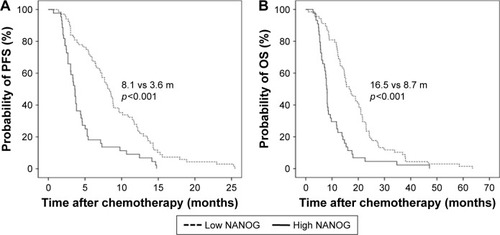
Table 2 Survival analyses results according to clinical parameters in all study subjects
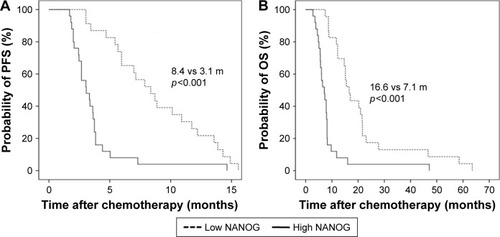
Figure 4 Kaplan–Meier survival curves for progression-free survival (A) and overall survival (B) in patients with adenocarcinoma. p-values were determined using the log-rank test.
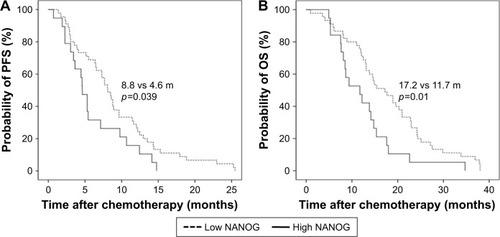
Figure 5 Kaplan–Meier survival curves for progression-free survival (A) and overall survival (B) in patients with squamous cell carcinoma. p-values were determined using the log-rank test.