Figures & data
Table 1 Demographic and clinicopathological characteristics of patients with NSCLC
Figure 1 Trends of demographic and clinicopathological characteristics for NSCLC from 1988 to 2008. Sample means (A: age of diagnosis) and proportions (B: summary stage; C: lymph node metastasis; D: histological grade; E: sex; and F: pathological type) of NSCLC cases are shown by year of diagnosis. One-way ANOVA analysis (A) and Cochran–Armitage trend test (B–F) were used, all P-values <0.001.
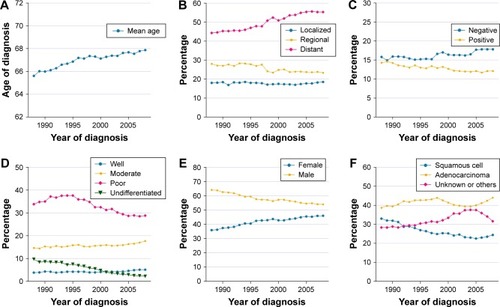
Figure 2 Kaplan–Meier survival analysis for overall (A) and specific stages of patients: (B) Localized, (C) Regional, and (D) Distant, with NSCLC between 1988 and 2008 grouped by periods of diagnosis. All P-values <0.001.
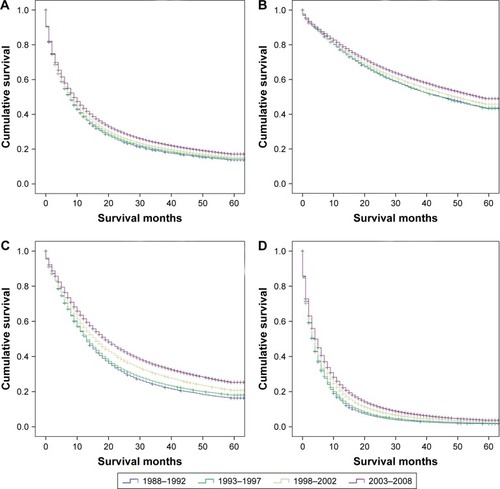
Figure 3 Trend of surgery rate (A) and Kaplan–Meier survival analysis for surgical (B) and non-surgical (C) groups. Cochran–Armitage trend test was used to evaluate trend (A); all P-values <0.001.
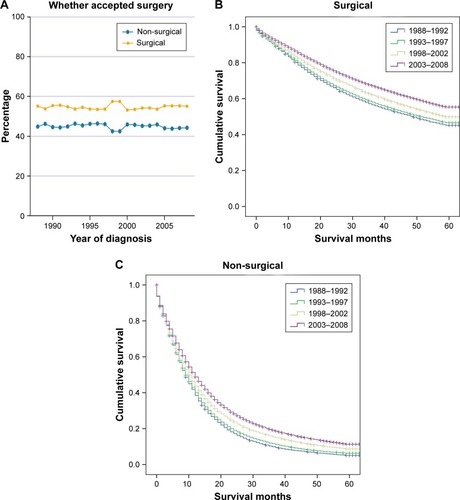
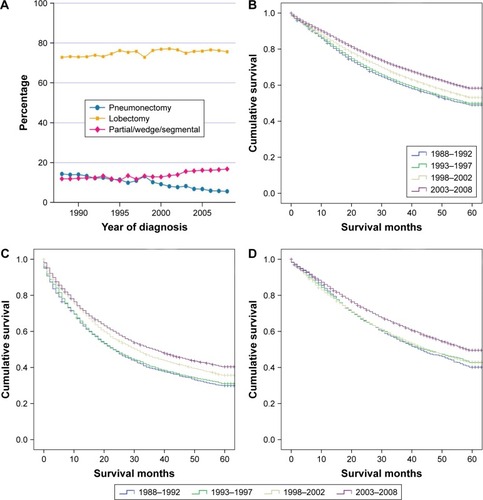
Figure 4 Trend of distribution of surgical approaches for NSCLC cases (A) and Kaplan–Meier survival analysis for specific surgical approaches (B) lobectomy, (C) pneumonectomy, and (D) partial/wedge/segmental resection. Cochran–Armitage trend test was used to evaluate trend (A); all P-values <0.001.