
Figures & data
Figure 1 S100A16, E-cadherin, and vimentin expression in lung adenocarcinoma. (A) The majority of the tumor cells showed membranous S100A16 expression (arrows) in lung adenocarcinoma (×400 magnification). (B) Membranous staining of the tumor cells (arrows) was considered to be a positive result for E-cadherin (arrow, ×200 magnification). (C) Cytoplasmic staining of the tumor cells (arrow heads) was considered to be a positive result for vimentin (×200 magnification).
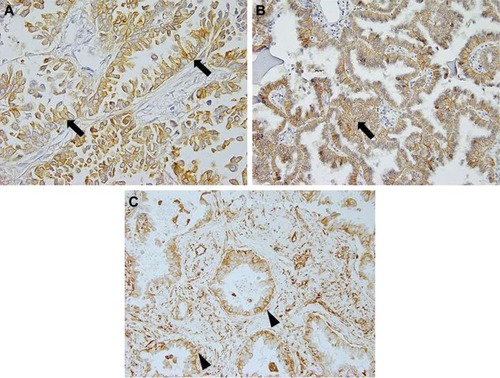
Table 1 Characteristics of the patients
Table 2 Relationships between S100A16 expression and clinic-opathological parameters
Figure 2 Survival analysis. (A) DFS; (B) OS.
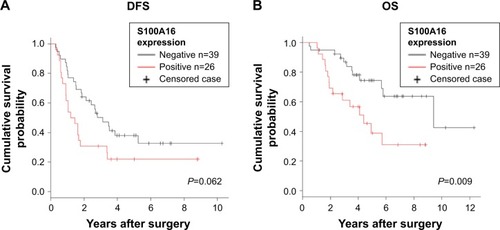
Table 3 Univariable and multivariable analyses of the effects of S100A16 expression on OS
Table 4 Relationships between S100A16 expression and EMT markers E-cadherin and vimentin