
Figures & data
Table 1 Patient characteristics and clinical evaluation at baseline
Figure 1 Kaplan–Meier disease free survival curve (A) and overall survival curve (B) of triple negative breast cancer patients treated with cisplatin or carboplatin.
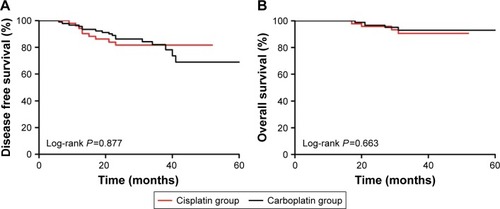
Table 2 Clinical and pathological evaluation
Table 3 Odds ratios for pathological complete response according to subgroups
Table 4 Most common adverse events reported as possibly, probably, or definitely related to treatment