
Figures & data
Table 1 Correlations between Fn level and clinicopathological parameters in stage III/IV CRC patients
Figure 1 Fn level in tumor and adjacent normal tissues of stage III/IV CRC patients.
Abbreviations: Fn, Fusobacterium nucleatum; CRC, colorectal cancer; ROC, receiver operating characteristic.
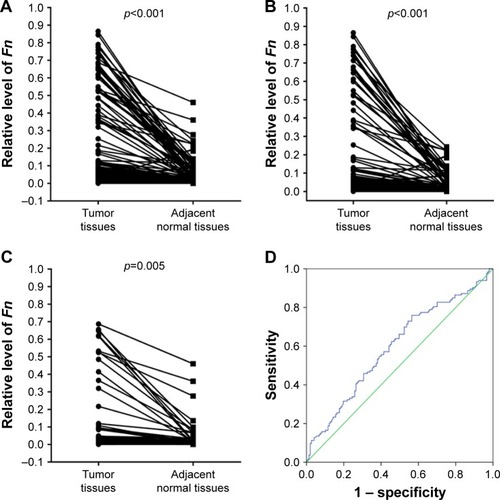
Figure 2 Prognostic significance of Fn in stage III/IV CRC patients.
Abbreviations: Fn, Fusobacterium nucleatum; CRC, colorectal cancer; CSS, cancer-specific survival; DFS, disease-free survival.
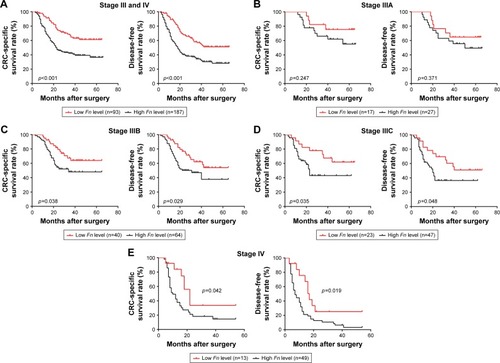
Table 2 Univariate and multivariate analysis for prognostic factors in cancer-specific survival of stage III/IV CRC patients
Table 3 Univariate and multivariate analysis for prognostic factors in disease-free survival of stage III/IV CRC patients
Figure 3 Correlations between Fn level and chemotherapy benefits in stage III/IV patients.
Abbreviations: Fn, Fusobacterium nucleatum; CRC, colorectal cancer; CSS, cancer-specific survival; DFS, disease-free survival.
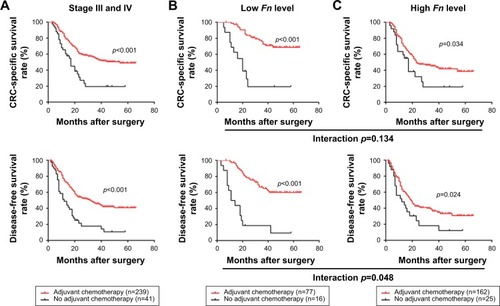
Figure 4 Representative immunohistochemical staining images of EMT and CSC markers in CRC tissues.
Abbreviations: CRC, colorectal cancer; EMT, epithelial-to-mesenchymal transition; CSC, cancer stem cell.
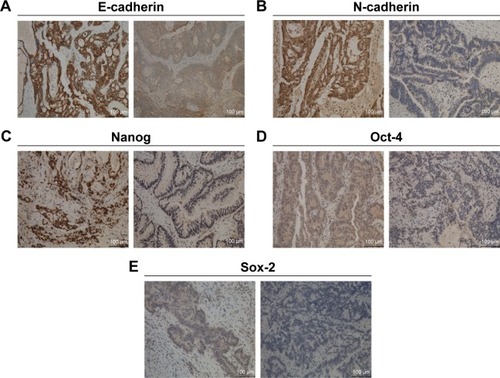
Figure 5 Prognostic significance of epithelial-to-mesenchymal transition and cancer stem cell markers in stage III/IV CRC patients.
Abbreviations: CRC, colorectal cancer; CSS, cancer-specific survival; DFS, disease-free survival.
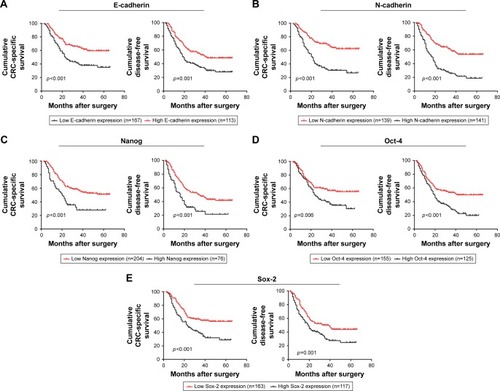
Table 4 Correlations of Fn with EMT/CSC markers in stage III/IV CRC patients
Figure S1 The ROC curve analysis is used to determine the cutoff values of staining scores of epithelial–mesenchymal transition and cancer stem cell markers.
Notes: (A) E-cadherin; (B) N-cadherin; (C) Nanog; (D) Oct-4; (E) Sox-2.
Abbreviation: ROC, receiver operating characteristic.
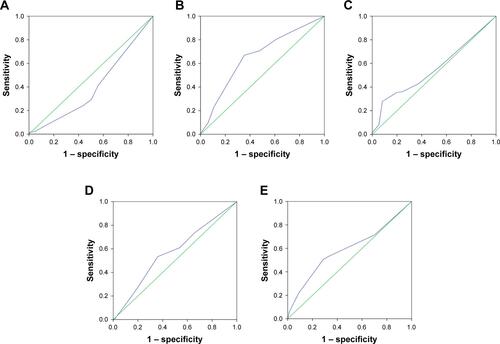
Table S1 Correlations between epithelial-to-mesenchymal transition/cancer stem cell markers and clinicopathological characteristics