
Figures & data
Figure 1 Abdominal CT images show that one of the lesions was located in the left lobe of the liver and the other was located in the para-aortic lymph node (A and B). In the venous phase, the mass was of low density and was irregular.
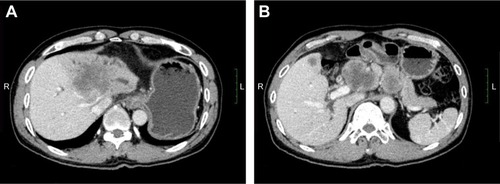
Figure 2 Pathologic evidence of intrahepatic cholangiocarcinoma (A ×100, ×400) showing adenocarcinoma infiltration of normal liver tissue. Immunohistochemical staining showed that CK 18, CK 19, CK 7, and Cox-2 were positive, while CDX 2, CK 20, Glypican 3, and Hep-1 were negative, which support adenocarcinoma from the intrahepatic bile duct (B, CK 19; C, Hep-1; D, CK 18; E, CK 7; F, Cox-2; G, CK 20; H, Glypican 3; ×100, ×400).
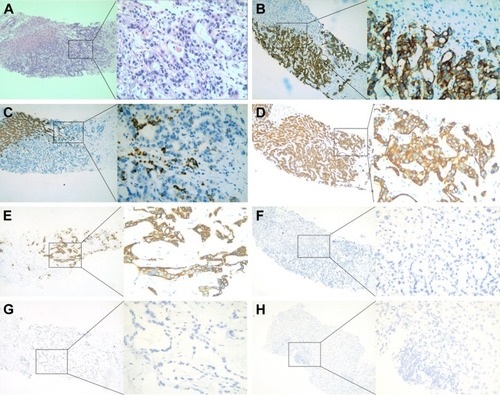
Figure 3 Confirmation of tumor shrinkage. A CT scan on August 5, 2015, revealed the tumor to be smaller after chemotherapy. (A), lesion located in the left lobe of the liver, (B) lesion located in the para-aortic lymph node.
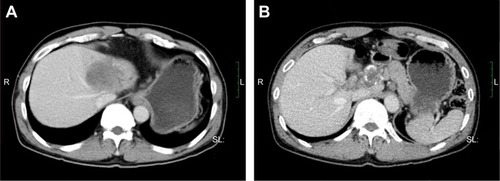
Figure 4 Tumor size before and after 1 month of treatment with apatinib.
Abbreviations: CT, computed tomography; PD-1, programmed death-1.
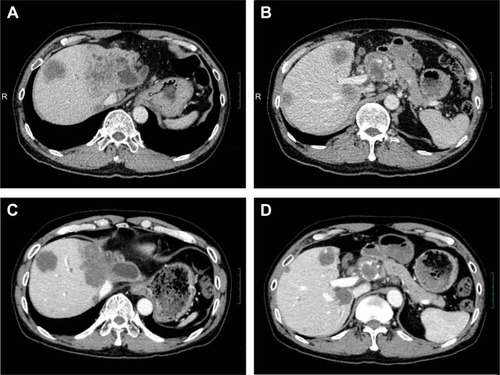
Figure 5 The tumor was larger after apatinib treatment was stopped, and a CT scan after 2 months suggested progressive disease (A and B, September 9, 2016).
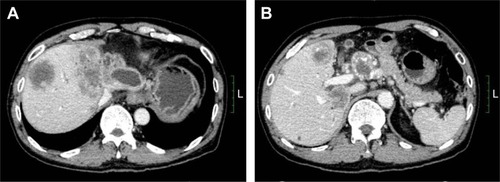
Figure 6 Stable disease after second round of apatinib use (A and B, May 11, 2017).
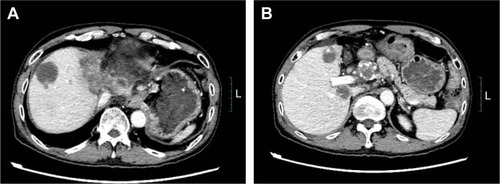
Figure 7 The various treatments the patient received as well as the duration of each treatment.