Figures & data
Table 1 Characteristics of included studies
Figure 1 Forest plot and meta-analysis of the overall survival of the PD-L1 high expression group compared with the low expression group.
Note: High PD-L1 expression was correlated with poorer overall survival in PC patients (HR: 1.76, 95% CI: 1.43–2.17, P<0.00001).
Abbreviations: df, degrees of freedom; HR, hazard ratio; IV, generic inverse variance method; PC, pancreatic cancer; PD-L1, programmed death-ligand 1; SE, standard error.
Abbreviations: df, degrees of freedom; HR, hazard ratio; IV, generic inverse variance method; PC, pancreatic cancer; PD-L1, programmed death-ligand 1; SE, standard error.
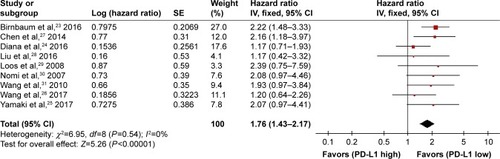
Table 2 Meta-analysis: correlation between PD-L1 overexpression and clinicopathologic characteristics
Figure 2 Subgroup analysis based on the methods used to detect PD-L1 expression.
Note: A statistical significance of the pooled HR was observed in both the subgroup with PCR method (HR: 2.24, 95% CI: 1.53–3.28, P<0.0001) and the subgroup with IHC method (HR: 1.59, 95% CI: 1.23–2.04, P=0.0003) between high and low PD-L1 expression groups.
Abbreviations: df, degrees of freedom; HR, hazard ratio; IHC, immunohistochemistry; IV, generic inverse variance method; PCR, polymerase chain reaction; PD-L1, programmed death-ligand 1; SE, standard error.
Abbreviations: df, degrees of freedom; HR, hazard ratio; IHC, immunohistochemistry; IV, generic inverse variance method; PCR, polymerase chain reaction; PD-L1, programmed death-ligand 1; SE, standard error.
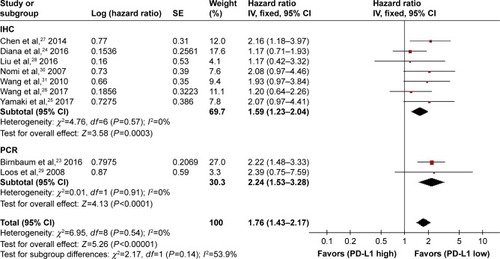
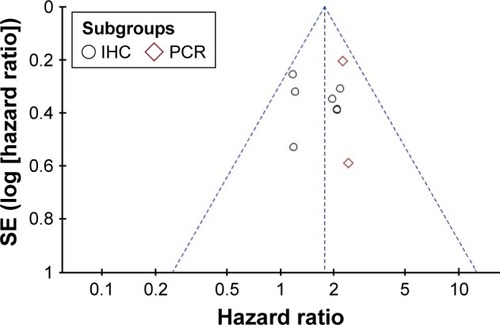
Figure 3 Funnel plot illustrating the meta-analysis of the overall survival.
Note: There was no obvious publication bias.
Abbreviations: IHC, immunohistochemistry; PCR, polymerase chain reaction; SE, standard error.
Abbreviations: IHC, immunohistochemistry; PCR, polymerase chain reaction; SE, standard error.