
Figures & data
Figure 1 Volcano plot of differentially expressed miRNAs.
Abbreviations: FC, fold change; FDR, false discovery rate.
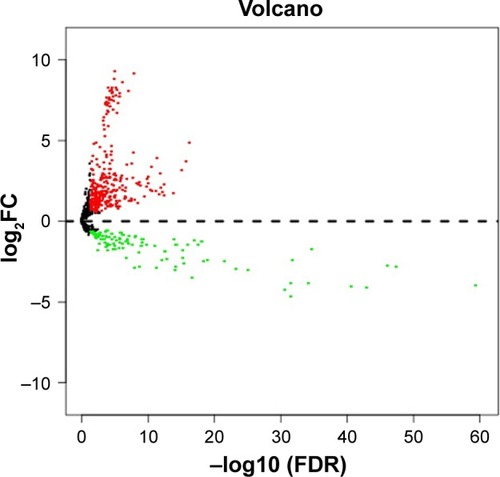
Figure 2 Identification of key modules associated with the progression of BC.
Notes: (A) Results of a cluster analysis and five modules identified from DEM expression networks. (B) The blue module had the highest mean gene significance among these modules. (C) Relationship between gene significance and intramodular connectivity.
Abbreviations: BC, bladder cancer; DEMs, differentially expressed miRNAs.
Abbreviations: BC, bladder cancer; DEMs, differentially expressed miRNAs.
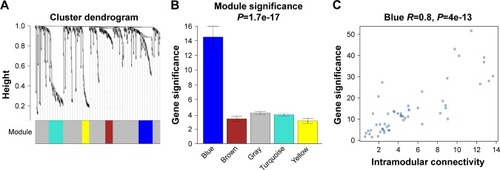
Table 1 Top 25% of the 54 miRNAs showing the highest connectivity and MM values in the blue module
Figure 3 A network of hub miRNAs and their target genes.
Notes: The cumulative weighted context++ scores, which indicate how effectively a given miRNA may target mRNAs, are shown by the node color. The figure was generated using CytoScape.
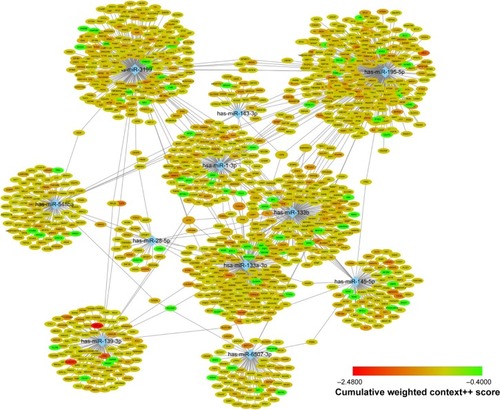
Figure 4 Functional annotations of the target genes.
Notes: (A) The 27 enriched GO biologic process terms. (B) The 17 enriched KEGG pathways.
Abbreviations: GO, Gene Ontology; KEGG, Kyoto Encyclopedia of Genes and Genomes.
Abbreviations: GO, Gene Ontology; KEGG, Kyoto Encyclopedia of Genes and Genomes.
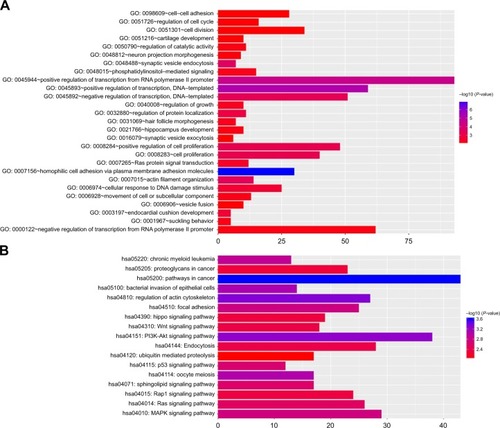
Figure 5 TAGLN2 is upregulated in human BC specimens.
Notes: (A, B) TAGLN2 expression in normal bladder tissue and BC specimens. (C) TAGLN2 expression in the TCGA BC RNAseq dataset (N=408). (D) Oncomine data showing TAGLN2 expression in normal (n=48) vs tumor (n=81) bladder specimens. (E) One-way ANOVA analysis showed that TAGLN2 expression levels were significantly associated with TNM stage in the TCGA BC RNAseq dataset.
Abbreviations: ANOVA, analysis of variance; BC, bladder cancer; N, normal; TCGA, The Cancer Genome Atlas; T, tumor.
Abbreviations: ANOVA, analysis of variance; BC, bladder cancer; N, normal; TCGA, The Cancer Genome Atlas; T, tumor.
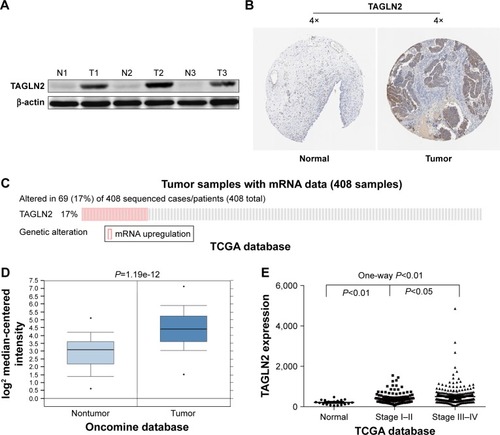
Table 2 Overall survival of the hub miRNAs in the blue module