50
Views
10
CrossRef citations to date
0
Altmetric
Review

Clinicopathological significance of HSP27 in gastric cancer: a meta-analysis

, , &
Pages 4543-4551 | Published online: 13 Sep 2017

Figures & data

Figure 1 Flowchart of study selection.

Figure 1 Flowchart of study selection.

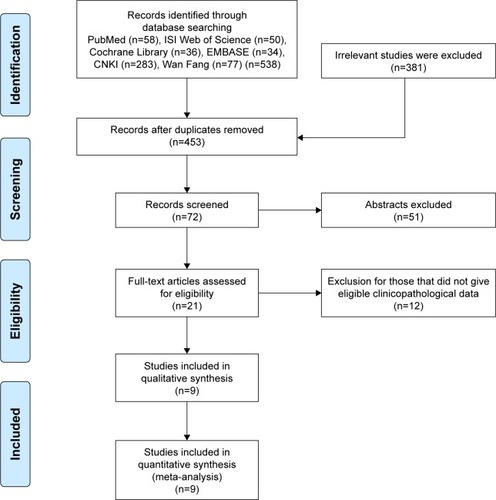
Table 1 Characteristics of studies included in the meta-analysis

Figure 2 Forest plot of studies evaluating the relationship between HSP27 expression and clinicopathological features: (A) expression; (B) lymph node metastasis; (C) serosal invasion; (D) gender; (E) tumor size; (F) differentiation; (G) TNM stage.

Note: Weights are from random effects analysis.
Abbreviations: OR, odds ratio; CI, confidence interval.
Figure 2 Forest plot of studies evaluating the relationship between HSP27 expression and clinicopathological features: (A) expression; (B) lymph node metastasis; (C) serosal invasion; (D) gender; (E) tumor size; (F) differentiation; (G) TNM stage.

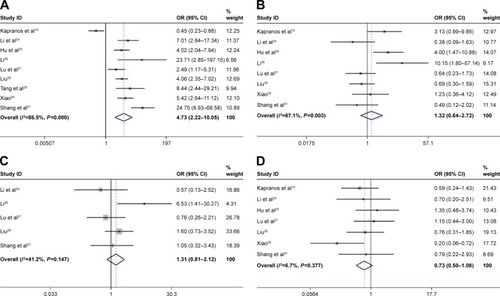
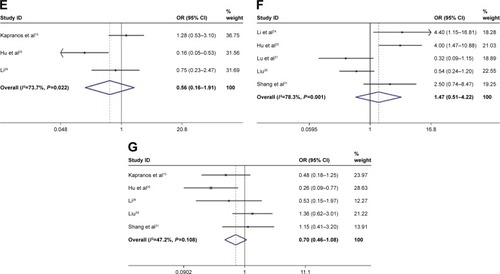
Table 2 HSP27 clinicopathological features for gastric carcinoma

Figure 3 Begg’s publication bias plot for HSP27 related studies: (A) expression; (B) lymph node metastasis; (C) serosal invasion; (D) gender; (E) tumor size; (F) differentiation; (G) TNM stage.

Abbreviations: SE, standard error; OR, odds ratio.
Figure 3 Begg’s publication bias plot for HSP27 related studies: (A) expression; (B) lymph node metastasis; (C) serosal invasion; (D) gender; (E) tumor size; (F) differentiation; (G) TNM stage.

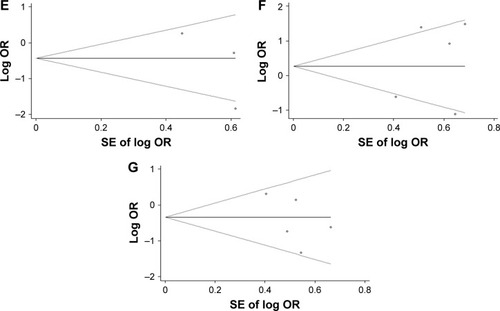
Table 3 Subgroup analysis of expression, lymph node metastasis, tumor size, and differentiation