Figures & data
Table 1 Clinicopathological characteristics of 329 patients with NMIBC stratified by EORTC-GUCG risk group
Figure 1 Kaplan–Meier survival curves for recurrence-free survival of all patients with non-muscle-invasive bladder cancer stratified by EORTC-GUCG risk scoring system.
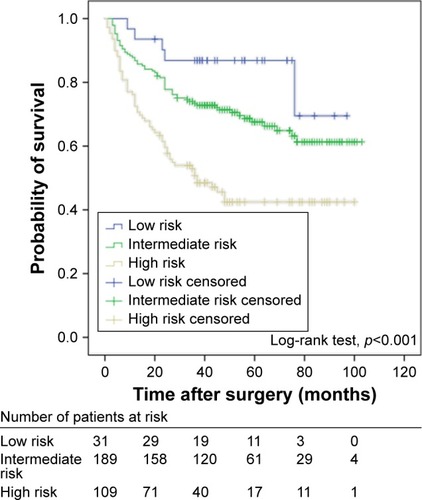
Table 2 Clinicopathological characteristics of 329 patients with NMIBC stratified by PNI
Figure 2 Kaplan–Meier survival curves for recurrence-free survival of patients with non-muscle-invasive bladder cancer stratified by PNI.
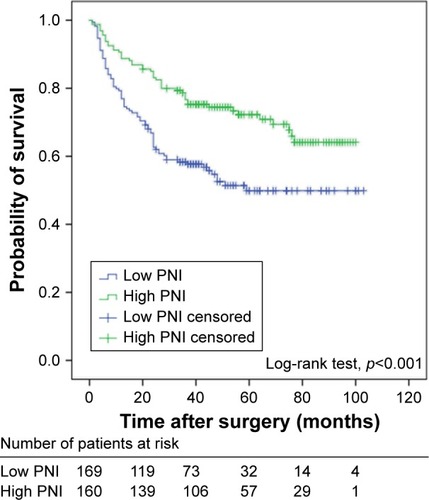
Figure 3 Kaplan–Meier survival curves for different EORTC-GUCG risk groups of patients with non-muscle-invasive bladder cancer stratified by PNI: (A) low risk; (B) intermediate risk; and (C) high risk.
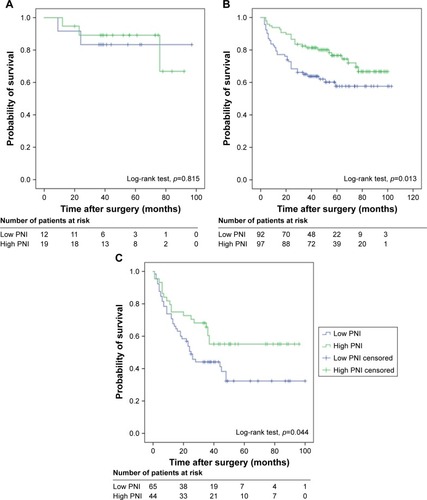
Table 3 Univariate and multivariate Cox proportional hazards regression analyses of RFS in 329 patients with NMIBC
Figure 4 Nomogram for predicting RFS in patients with non-muscle-invasive bladder cancer.
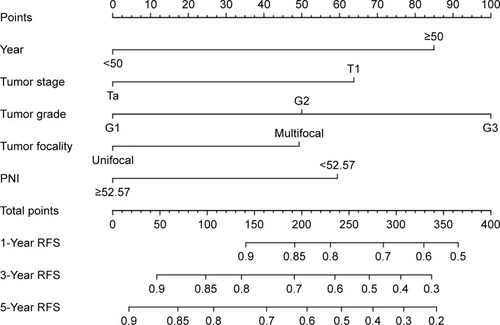
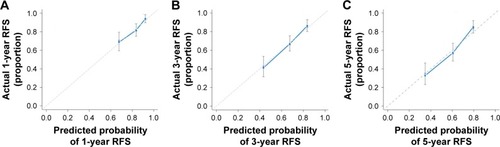
Figure 5 Calibration curves for internal validation of estimating RFS in patients with non-muscle-invasive bladder cancer: (A) 1-year outcome; (B) 3-year outcome; and (C) 5-year outcome.